 grenke around the globe


Please note that this website shows an excerpt from the grenke AG Annual Report 2025. The annual report, which is also available in the “Reports & Key Figures” section of the grenke AG website, prevails.
Combined Management Report


Macroeconomic environment
The global macroeconomic and geopolitical environment in 2025 was characterised by ongoing and new challenges and uncertainties. The ongoing conflicts between Russia and Ukraine, as well as in the Middle East, both had numerous direct and indirect implications for economic developments. Shifts in political leadership, particularly in the United States and those triggered by it, had far-reaching impacts on both national and international economic policies. The tariff increases introduced by the United States in spring 2025 significantly disrupted transatlantic trade flows. Although the agreement reached in April 2025 removed the previously existing uncertainty regarding tariff levels, the reliability of U.S. policy is questioned by its trading partners. Discussions regarding a potential expansion of export restrictions on rare earths by China, particularly in the third quarter of 2025, placed additional strain on international trade relations. Persistent uncertainty complicates corporate planning and, as a result, dampens investment demand.
Within the euro area, a moderate economic recovery was evident, despite the challenging environment, while insolvency rates remained high.
Globally, monetary policy easing by central banks provided stimulus to economic activity. The European Central Bank (ECB) entered 2025 with a benchmark rate of 3 percent (January 2024: 4 percent). After starting to ease monetary policy in June 2024, the ECB initially continued this approach into 2025. By June 2025, following four additional interest rate cuts, the benchmark rate had been reduced to 2 percent. The ECB then paused further rate changes and maintained this level for the remainder of the year. As a result, the benchmark interest rate stood at 2 percent in December 2025, below the previous year’s level (December 2024: 3 percent).
Inflation in the euro area began 2025 at a peak of 2.5 percent in January, briefly fell below the European Central Bank’s 2 percent target to 1.9 percent in May, and then fluctuated between 2.0 and 2.2 percent in the months that followed through year-end, ultimately reaching precisely the ECB’s target of 2.0 percent in December. With an average annual rate of 2.1 percent in 2025, the ECB expects inflation to stabilise around its 2 percent target over the medium term.
In the United States, the target range for the key interest rate at the start of 2025 was 4.25 to 4.5 percent. Following three rate cuts in the second half of the year, the range stood at 3.5 to 3.75 percent in December 2025. U.S. inflation, as measured by the personal consumption expenditures (PCE) index relevant to the Fed’s inflation target, was 2.6 percent in January 2025, dipped to a temporary low of 2.3 percent in April, and rose again to 2.8 percent in November. The alternative consumer price index (CPI), for which year-end data is available, recorded an inflation rate of 3.0 percent in January 2025 and 2.7 percent in December 2025, with an annual average of 2.6 percent.
In its World Economic Outlook published on January 19, 2026, the International Monetary Fund (IMF) assessed the global economy in 2025 as resilient in the face of newly imposed tariffs and heightened political uncertainty. Overall, the global economy adjusted to the changing conditions, supported by accommodative financing conditions and gradually stabilising trade relations over the course of the year. Global trade remained relatively resilient, as the expansion of technology-related exports offset weaker momentum in other export categories. Accordingly, the IMF estimated global gross domestic product (GDP) growth in 2025 at 3.3 percent, unchanged from the previous year. While growth in the United States slowed to 2.1 percent year-on-year, the euro area recorded improved growth of 1.4 percent. Within the euro area, Germany, France, and Italy posted below-average growth, whereas Spain’s economy was significantly more dynamic. Great Britain matched the euro area, with growth also at 1.4 percent.
Economic growth according to the IMF
Percent
2025
2024
Worldwide
3.3
3.3
United States
2.1
2.8
Euro area
1.4
0.9
Germany
0.2
– 0.5
France
0.8
1.1
Italy
0.5
0.7
Spain
2.9
3.5
United Kingdom
1.4
1.1
A survey of companies in the euro area published by the ECB on February 2, 2026, pointed to a continued deterioration in financing conditions in the fourth quarter of 2025 compared with the previous quarter. A greater number of surveyed companies than in the preceding quarter reported that interest rates on bank loans had risen. In addition, more companies observed a tightening of credit conditions relating to charges such as fees or commissions. Collateral requirements were perceived to be at a similarly high level as in the previous quarter.
According to estimates by Eurostat, corporate insolvencies in the European Union continued to increase. The relevant index was estimated at 195.9 points in the fourth quarter of 2025, exceeding the corresponding quarter of the previous year by 11.0 percent (fourth quarter of 2024: 176.5 points). In a country comparison, France was significantly above the aggregate value at 260.4 points (Q4 2024: 258.6 points). Spain, at 151.8 points (Q4 2024: 148.0 points), was slightly below the aggregate value, while Italy, at 115.9 points (Q4 2024: 107.2 points), performed markedly better. For Germany, for which a Eurostat index is not currently available, the German Federal Statistical Office (Destatis) reported a 15.2 percent increase in regular insolvencies in December 2025 compared with the same month of the previous year.
For full-year 2025, Allianz Trade estimates global insolvencies grew 6 percent compared to the previous year (2024: 10 percent). In the eurozone, insolvencies are forecast to rise by 7 percent (2024: 17 percent). The sharpest increase is expected in Italy, with a 35 percent rise (2024: 17 percent); there, the upswing in insolvencies began from a low base in mid-2023, but case numbers have since exceeded pre-pandemic levels, as in most other countries. In Germany +11 percent (2024: 22 percent) and France +2 percent (2024: 17 percent), Allianz Trade anticipates a further increase in insolvencies for 2025, although the pace – similar to other countries – is expected to slow somewhat. In Spain, the insolvency situation is projected to stabilise at 0 percent year-on-year (2024: 18 percent).
The euro area’s Purchasing Managers’ Index (PMI) for the manufacturing and services sectors reached 51.5 points in December 2025 (December 2024: 49.6 points), signalling expansion with a value above the 50-point threshold. The index is derived from a monthly survey of purchasing managers in the manufacturing and services sectors, assessing new orders, production, employment, deliveries received, and inventory levels. The PMI serves as a leading indicator, with values above 50 points indicating an increase in production and values below 50 points signalling a decline in production across the sectors surveyed.
The German companies surveyed by the ifo Institute were more optimistic at the end of 2025 than in the same month of the prior year. The ifo Business Climate Index, which summarises companies’ assessments of their current business situation and their expectations for the subsequent six-month period, stood at 87.6 points in December 2025 (December 2024: 84.9 points). Business expectations showed a marked improvement to 89.7 points (December 2024: 84.8 points). At 85.6 points, assessments of the current situation were also more positive year-on-year (December 2024: 85.1 points).
Despite this challenging environment, we once again succeeded in continuing our growth trajectory in leasing new business in 2025 and in achieving our new business profitability target.
A persistently high level of insolvencies resulted in an increase in the loss ratio for full-year 2025 to 1.7 percent (previous year: 1.3 percent).
Sector environment
The ifo Business Climate Index for the leasing sector in Germany reached 10.0 points in December 2025 (December 2024: 0.4 points). Leasing companies assessed the current business situation in December 2025 at 22.1 points, more positively than the outlook for the next six months, which stood at –1.5 points. According to the Federal Association of German Leasing Companies (BDL), this reflects a generally solid business environment despite economic headwinds, though momentum is expected to weaken. The ifo Business Climate Index is calculated as the average of the balances from surveyed companies’ assessments of the current business situation and their business expectations. In recent years, the ifo Business Climate Index and its two components have fluctuated between – 50 points and +75 points.
For full-year 2025, the BDL forecasts a 5.1 percent year-on-year increase in leasing new business based on acquisition values. Excluding big tickets – primarily in the air, rail, and water vehicle segments – growth is estimated at 3.3 percent. The object groups tracked by the BDL do not fully correspond to our portfolio. Due to the persistent reluctance to invest, as noted by the BDL, leasing new business declined in the areas of production machinery, construction equipment, and agricultural technology. Medical technology, IT, software, and cloud applications, as well as systems for generating renewable energy, all developed positively.
According to statistics from Leaseurope for the first half of 2025 (full-year figures were not yet available at the time of publication), leasing new business for equipment investments (excluding automobiles) in the European market fell 8.7 percent year-on-year (H1 2024: 0.5 percent). Our lease objects fall within the equipment investment categories published by Leaseurope, although these encompass a broader range of lease objects than our focus on lower purchase values. In Great Britain, the largest leasing market, leasing new business in equipment investments grew by 3.9 percent year-on-year, with Italy also posting an increase of 12.9 percent. Declines, on the other hand, were recorded in Germany (– 37.5 percent), Spain (–11.0 percent), and France (– 9.5 percent).
Macroeconomic influences on business development
Following the interest rate cuts initiated by the European Central Bank in 2024, the interest rate environment continued to ease over the course of the year, with a key interest rate of 3 percent at the start of 2025. Interest rate developments in the euro area continued to affect our business during the reporting year. While more favourable financing conditions typically stimulate investment demand, geopolitical uncertainties tend to have a dampening effect on corporate investment. Since lease instalments are set at the time the investment is made and the contract is concluded, leasing provides our target customers with a reliable basis for financial planning in times of volatile markets and difficult-to-forecast interest rates. At the same time, leasing represents a financing option that preserves liquidity.
Total leasing new business continued to grow in the reporting year, as detailed in Chapter 2.5. This growth was likely due to companies choosing to use lease financing for their investments in replacements and expansion – particularly digitalisation initiatives and green economy objects. Unlike loans, where liquidity is provided upfront and may not necessarily be used for investments, lease contracts are typically linked to operationally essential objects, demonstrating a tangible medium- to long-term investment requirement.
The CM2 margin – the benchmark for the projected profitability of our leasing new business – reached our target of over 16.5 percent in the reporting year, amounting to 16.7 percent.
The ongoing sanctions against Russia had no direct impact on our business during the reporting year. We are also not directly affected by the war in Ukraine or the conflict in the Middle East, as we do not have any locations or exposures in these countries. Indirect effects from the geopolitical conflicts and uncertainties described in Chapter 2.1, as well as from persistently high insolvency levels, were reflected to us in the form of higher payment defaults and increased expenses for the settlement of claims and risk provision. As a result, the loss rate increased compared with the previous year; see Chapter 2.6 for further details.
Other macroeconomic influences, such as the impact of changes in capital market and central bank interest rates on refinancing costs as well as geopolitical risks, are discussed in detail in Chapter 5.4.1 of the Risk report.
Significant events
On January 16, 2025, we issued a new Additional Tier 1 bond (AT1) with a nominal volume of EUR 200.0 million. In connection with this new issue, previously issued AT1 bonds were repurchased in the first and third quarters of the financial year.
On January 28, 2025, grenke AG entered into a strategic partnership with Italy’s largest bank, Intesa Sanpaolo S.p.A. (ISP), for the Italian operating leasing market. Under the agreement, the parties agreed that Intesa Sanpaolo Rent Foryou S.p.A. (RFY), a subsidiary of ISP, will be contributed in full into grenke Locazione S.r.l., grenke AG’s Italian subsidiary, by the middle of the 2025 financial year. In return, ISP will receive a 17 percent equity interest in grenke Locazione. As of the end of the first quarter of 2025, the partnership was still subject to the approval of the relevant authorities. grenke’s business model remains unchanged and focuses on small-ticket leasing, with the acquisition value of contracts averaging under EUR 10k. The partnership is intended to help both companies strengthen their competitive position in this segment, accelerate growth, and expand their joint market share. On May 2, 2025, the competent antitrust authority approved the strategic partnership between grenke AG and Intesa Sanpaolo S.p.A. (ISP). As a result, all of RFY’s shares were transferred to our Italian subsidiary on May 20, 2025, as scheduled.
On April 2, 2025, grenke AG announced that the Supervisory Board had appointed Isabel Tufet Bayona as the new Chief Operating Officer (COO), effective September 1, 2025. Her responsibilities will include the entire back office operations, including the Credit Center, internal control functions such as risk controlling, compliance, anti-money laundering, information security, data protection, and human resources.
On April 2, 2025, grenke entered into an agreement with Swiss-based Teylor AG for the phased acquisition of its factoring business (“signing”). The transition of the individual local subsidiaries from grenke to Teylor (“closing”) is expected to be completed by mid-2026. On April 9, 2025, the closing for the first local subsidiary was completed. In this context, grenke AG legally transferred 100 percent of the shares in its Polish factoring subsidiary, GC Faktoring Polska Sp. z o.o. Effective August 1, 2025, the controlling influence over Teylor Polska Sp. z o.o. (formerly GC Faktoring Polska Sp. z o.o.) was transferred from grenke AG to Teylor AG following the replacement of existing refinancing arrangements. Due to the loss of controlling influence as defined in IFRS 10 Consolidated Financial Statements, the Polish factoring company was deconsolidated in the third quarter.
On April 17, 2025, the Supervisory Board of grenke AG approved the winding-down of the factoring company in Switzerland (GRENKEFACTORING AG). The Swiss factoring company is not part of the acquisition agreement with Teylor AG.
On May 7, 2025, grenke AG held its ordinary Annual General Meeting. This meeting resolved a dividend distribution of EUR 0.40 per share (previous year: EUR 0.47). The distribution was based on the dividend-entitled share capital as of the date of the Annual General Meeting.
On June 6, 2025, grenke digital GmbH completed the legal acquisition of the shares in B2F S.r.l. and Selfrent S.r.l., both based in Milan, Italy. The two service providers, B2F S.r.l. and Selfrent S.r.l., operate technology platforms specialising in the integration of payment solutions into eCommerce shops. This acquisition allows us to further advance our digitalisation strategy and offer leasing as an additional payment option directly within online shopping.
On June 20, 2025, the signing took place for the acquisition of the franchise companies in Latvia and Chile, which were already fully consolidated in the consolidated financial statements.
On August 5, 2025, grenke AG legally acquired the leasing franchise company in Chile (GC Rent Chile SpA). On August 15, 2025, the leasing franchise company in Latvia (SIA GC Leasing Baltic) was also legally acquired. Both franchise companies were already fully consolidated before the acquisition of the shares, so the legal acquisition of the shares resulted solely in a reduction of the reported non-controlling interests.
On October 9, 2025, grenke AG legally acquired the leasing franchise company GL Leasing British Columbia Inc. On November 28, 2025, the legally effective acquisition of the leasing franchise companies GC Leasing Ontario Inc. and GC Crédit-Bail Québec Inc. was completed. The acquisitions were carried out via GL Leasing British Columbia Inc. All three Canadian franchise companies had already been fully consolidated prior to the acquisition of the shares, meaning that the legally effective acquisition of the shares merely resulted in a reduction of the non-controlling interests reported.
On November 21, 2025, grenke AG acquired the factoring agency in Portugal (GWFACT-Invoice Solutions Lda.) from financial investors and its Managing Director. The company is classified as held for sale and recognised as a discontinued operation.
Actual and forecast business performance
On March 13, 2025, with the release of the Annual Report 2024, we refined our guidance for leasing new business and Group earnings for the 2025 financial year.
The Board of Directors had expected leasing new business of between EUR 3.2 billion and EUR 3.4 billion and Group earnings after taxes of EUR 71 million to EUR 81 million for the 2025 financial year. For the CM2 margin, the Board communicated that it expected a margin of over 16.5 percent for 2025. The guidance for the 2025 Group earnings was based on the assumption that the loss rate would be around 1.6 percent. Under this earnings outlook, the cost-income ratio (CIR) was projected to remain below 60 percent. For the 2025 financial year, the Board of Directors assumed that no capital measures would be required for the foreseeable future and that maintaining an unchanged benchmark of approximately 16 percent for the balance sheet equity ratio would be more than adequate.
On the occasion of the publication of the third quarter report on November 13, 2025, the Board stated in its guidance assessment that the achievement of Group earnings within the projected target range would likely be influenced by risk provisions and if the loss rate remained close to the 1.8 percent of the first three quarters, the 2025 Group earnings would likely come in at the lower end of the guidance range.
In the 2025 financial year, grenke generated leasing new business of EUR 3.3 billion, achieving the midpoint of its guidance range for the year of EUR 3.2 billion to EUR 3.4 billion. Compared to the previous year, this represented an increase of 7.8 percent. The CM2 margin reached 16.7 percent (2024: 17.0 percent), meeting the set target of over 16.5 percent.
In the 2025 financial year, grenke generated Group earnings after taxes of EUR 71.8 million, thereby reaching the lower end of the guidance range of EUR 71 million to EUR 81 million.
In the 2025 financial year, the loss rate was 1.7 percent, exceeding the long-term average of 1.5 percent. The cost-income ratio came in at 55.2 percent, below the target threshold of 60 percent.
As announced, no capital increase was carried out. As a result of our growth, the balance sheet equity ratio decreased as expected to 15.6 percent at year-end, remaining in line with the long-term benchmark value of 16 percent.
Guidance and actual performance
Financial year
2025
Guidance 2025
as of March 13
Financial year
2024
Group earnings (in EUR millions)
71.8
71 to 81
70.2
Leasing new business (in EUR billions)
3.3
3.2 to 3.4
3.1
Assumptions
Equity ratio1
15.6%
~ 16%
16.2%
Cost-income ratio
55.2%
< 60%
59.2%
Loss rate2
1.7%
~ 1.6%
1.3%
CM2 margin of new leasing business
16.7%
> 16.5%
17.0%
1 Adjustment in accordance with IAS 8 (see Note 2.3 of the notes to the consolidated financial statements)
2 With the publication of the Quarterly Statement Q3 on November 13, 2025, the Board of Directors stated that with a loss rate of just under 1.8 percent (Q1– Q3 2025), the lower end of the guidance range for Group earnings would likely be achieved.
New business
Leasing new business
Leasing new business – defined as the total acquisition cost of newly acquired leased assets – reached an expected volume of EUR 3,294.6 million in full-year 2025 (previous year: EUR 3,057.0 million). This volume was 7.8 percent higher than in the previous year. We were able to generate a year-on-year increase in new business in every quarter of the reporting year. As a result, we have firmly continued our growth trajectory and, in our estimate, have grown faster than the market. A key driver of this growth was our dense dealer network. We currently work with more than 34,500 specialist reseller partners across 31 countries.
EURm
2025
2024
Change (%)
Leasing new business
3,294.6
3,057.0
7.8
DACH
801.4
705.1
13.7
Western Europe (without DACH)
851.1
784.4
8.5
Southern Europe
797.0
732.0
8.9
Northern/Eastern Europe
609.0
640.8
– 5.0
Other regions
236.0
194.8
21.2
Regions
DACH: Germany, Austria, Switzerland
Western Europe (without DACH): Belgium, France, Luxembourg, the Netherlands
Southern Europe: Italy, Croatia, Malta, Portugal, Slovenia, Spain
Northern/Eastern Europe: Denmark, Finland, UK, Ireland, Latvia, Norway, Poland, Romania, Sweden, Slovakia, Czechia, Hungary
Other Regions: Australia, Brazil, Chile, Canada, Turkey, USA, UAE
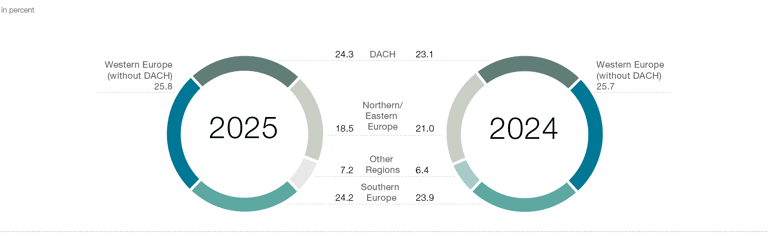
Share of leasing new business by region
We are particularly pleased that we could achieve this growth with an essentially unchanged margin. The contribution margin 1 (CM1) of our leasing new business rose by 13.5 percent in the 2025 financial year to EUR 389.6 million (previous year: EUR 343.2 million). The CM1 margin for the reporting year equalled 11.8 percent, exceeding the previous year’s level of 11.2 percent. This was primarily due to the fact that the terms and conditions of leasing contracts were adjusted to a lesser extent than the decline in refinancing costs during the reporting period. Contribution margin 2 (CM2) of leasing new business – which, due to our business model, is higher than CM1 as it incorporates risk costs as well as additional income components from services and subsequent business – increased by 6.1 percent to EUR 550.2 million in the 2025 financial year (previous year: EUR 518.5 million). The CM2 margin, which already reflects the sharply increased projected risk costs in 2025, decreased slightly from 17.0 percent in the previous year to 16.7 percent, thereby remaining slightly above our annual target of over 16.5 percent.
CM margins in leasing new business
in percent
2025
2024
Change (pp)
CM1 margin
11.8
11.2
0.6
CM2 margin
16.7
17.0
– 0.3
DACH
13.7
13.5
0.2
Western Europe (without DACH)
17.3
17.8
– 0.5
Southern Europe
17.0
16.9
0.1
Northern/Eastern Europe
17.9
18.3
– 0.4
Other regions
20.5
21.7
– 1.2
Contribution margins in leasing new business
EUR million
2025
2024
Change (%)
CM1
389.6
343.2
13.5
CM2
550.2
518.5
6.1
DACH
109.9
95.2
15.5
Western Europe (without DACH)
147.5
139.8
5.5
Southern Europe
135.4
123.8
9.4
Northern/Eastern Europe
109.0
117.6
– 7.3
Other regions
48.4
42.2
14.8
Under the revised segmentation introduced last year, the leasing segments align with the established regional divisions.
The first segment is the DACH region, comprising Germany, Austria, and Switzerland. Leasing new business in this region increased by 13.7 percent year-on-year to a total of EUR 801.4 million (previous year: EUR 705.1 million). As a result, the DACH segment was the second largest by volume within the grenke Group. Germany, the largest individual market in the region, achieved leasing new business growth of 15.1 percent and accounted for 81.5 percent of the DACH region’s leasing new business volume (previous year: 80.5 percent). Austria recorded the strongest growth in the segment, with a 17.7 percent increase in leasing new business. The CM2 margin equalled 13.7 percent for the reporting year (previous year: 13.5 percent), reflecting a slight increase driven by expected stable risk costs.
In the Western Europe (without DACH) segment, leasing new business increased by 8.5 percent in the reporting year to EUR 851.1 million (previous year: EUR 784.4 million). Western Europe (without DACH) accounted for the largest share of Group-wide leasing new business in the reporting year, with 25.8 percent. In France, the most important market in this region, the year-on-year increase was 9.0 percent. The Netherlands also made a significant contribution to the region’s new business growth with a rise of 13.4 percent, making it the fastest-growing market in Western Europe (without DACH) segment. The CM 2 margin declined slightly year-on-year to 17.3 percent due to increased risk provisioning (previous year: 17.8 percent).
The Southern Europe segment recorded the third-highest percentage increase in the reporting year, with leasing new business rising by 8.9 percent to EUR 797.0 million (previous year: EUR 732.0 million). Italy, the region’s largest market, made a significant contribution to this growth with a 10.6 percent increase in 2025, although the growth in the 2024 financial year had still been at 28.9 percent. The performance in the financial year in Italy was primarily driven by the M&A transaction with Intesa Sanpaolo, the country’s largest bank, and the subsequent integration. Spain was the second most important market in the segment by volume, with EUR 190.8 million (previous year: EUR 177.8 million). The CM2 margin rose slightly by 0.1 percentage points year-over-year, reaching 17.0 percent in the reporting year.
In the Northern/Eastern Europe segment, we recorded a decline in leasing new business of 5.0 percent, recording a volume of EUR 609.0 million (previous year: EUR 640.8 million). This was driven in part by grenke’s strategic disengagement from major telecommunications partners in the United Kingdom, as well as the removal of the tax incentive for job bikes in Finland. The United Kingdom was the strongest market in the segment, generating new business volume of EUR 163.3 million (previous year: EUR 176.5 million). In 2025, Finland was the second-largest market in the segment after the United Kingdom, with leasing new business of EUR 105.1 million. The CM2 margin for the Northern/Eastern Europe segment in 2025 amounted to 17.9 percent, which was a slight decline compared to the previous year (previous year: 18.3 percent).
Other Regions recorded a 21.2 percent rise in leasing new business in 2025 to a total of EUR 236.0 million (previous year: EUR 194.8 million). This segment includes the future growth markets the United States, Canada, and Australia. Among these, Australia led the segment, with leasing new business volume of EUR 65.7 million (previous year: EUR 59.1 million). Another growth driver for the Other Regions segment was Brazil, which contributed an increase in leasing new business of 24.5 percent to EUR 58.4 million in the reporting year (previous year: EUR 46.9 million), compared with growth of 54.7 percent in the previous year. The business in Chile further reinforced the positive growth trend, achieving new business growth of 33.6 percent to EUR 29.1 million (previous year: EUR 21.8 million). New business development in the United States was particularly positive. Following the opening of a second U.S. location in Chicago, Illinois, in the third quarter of 2024, new business volume almost quintupled compared with the previous year, albeit from a still low absolute level. In total, new business volume of EUR 18.8 million was generated. The CM2 margin came to 20.5 percent in the reporting year (previous year: 21.7 percent), reflecting a slight decline year-over-year.
Lease applications and contracts
Unit
2025
2024
Change
Lease applications
Units
675,368
632,572
6.8%
Lease contracts
Units
324,019
315,901
2.6%
Conversion rate
Percent
48.0
49.9
–1.9 pp
Average NAV
EUR
10,168
9,677
5.1%
Demand for leasing, particularly in the small-ticket segment, to finance and implement investments, remains strong internationally. In the 2025 financial year, as in the past five years, we continued to see a growing number of leasing applications (675,368) compared to the previous year (632,572). This growth was fuelled primarily by our consistent market development efforts, combined with the acquisition of new partners, the expansion of existing cooperations, and business activity in newer object categories such as the green economy. The total number of newly concluded lease contracts totalled 324,019 (previous year: 315,901), an increase of 2.6 percent, with a customary conversion rate (applications resulting in contracts) of 48.0 percent (previous year: 49.9 percent). The international markets (excluding DACH) accounted for 551,589 applications (previous year: 520,707), leading to 245,695 (previous year: 243,962) new contracts. The conversion rate in those markets was 44.5 percent for the full year of 2025 (previous year: 46.9 percent). The decline in the conversion rate is primarily attributable to a more selective acceptance of lease applications and to customers’ reluctance to make investments.
The mean acquisition value per lease contract increased 5.1 percent in 2025 to EUR 10,168 (previous year: EUR 9,677). This figure is within the defined target range, reflecting our focus on small tickets with an average ticket size of around EUR 10,000 for full-year 2025. The definition of “small-ticket” now encompasses investments of up to EUR 50,000, as new technologies, such as medical technology and robotics, have driven increased demand for smaller objects with values of up to EUR 50,000. The focus on small tickets continues to remain a key component of our strategy.
Share of object groups in the leasing portfolio by number of contracts
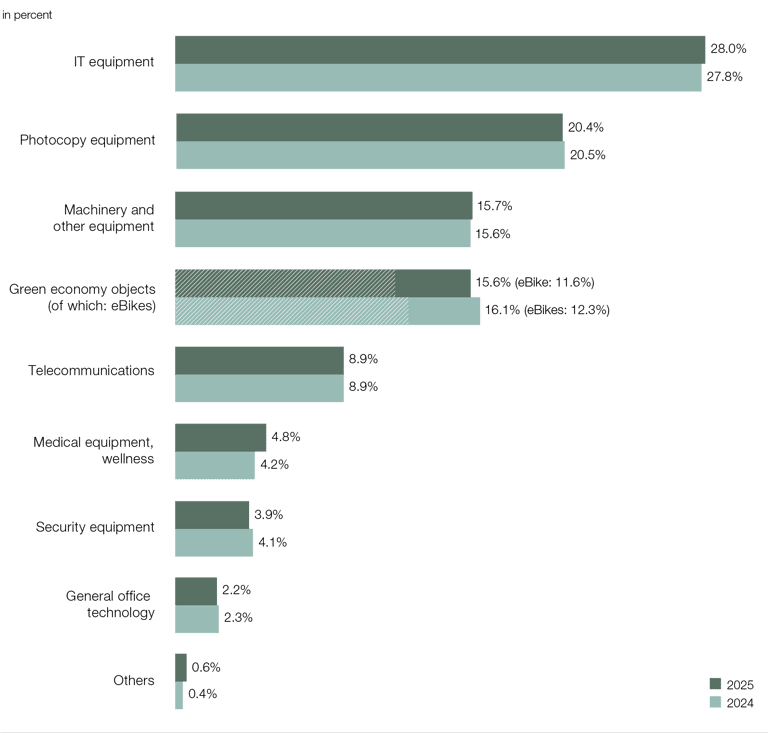
Our portfolio structure remained largely unchanged in 2025 compared to the previous year. The object groups with the largest shares were IT equipment, printing and photocopying technology, machinery and equipment, and green economy objects, which continue to include a high proportion of eBikes. Although the share of eBikes declined slightly by 0.7 percentage points, mainly due to the discontinuation of the tax benefit for job bikes in Finland, we still financed more than 40,000 eBikes and bicycles in 2025 alone. While the object groups photocopy technology and green economy saw only a slight decline compared to the previous year (each by less than 1 percent), medical technology and wellness recorded the strongest increase, rising 0.6 percentage points. In the other categories, we observed only minor changes in demand.
Changes in the average currency exchange rates against the euro compared with the previous year resulted overall in negative currency effects for the year as a whole, totalling EUR 12.8 million in leasing new business volume. Currency effects from the moderate depreciation of the Australian dollar and the Brazilian real were partially offset by a slight appreciation of the Swedish krona.
Factoring and grenke Bank new business
Following the change in segment reporting in the 2024 financial year, the Other segment includes the lending business of grenke Bank AG as well as the factoring business held for sale.
In the 2025 financial year, factoring generated new business with a purchased receivables volume of EUR 789.1 million (previous year: EUR 910.4 million). The decline is mainly attributable to the discontinuation of the factoring business in Poland, which was included in the figures only until July 31, 2025. Of this amount, 17.1 percent is related to receivables management (without a financing function). At the same time, this receivables volume, with an average duration from purchase to maturity of approximately 46 days – translates into a theoretical turnover rate of 7.9 times per year (365 days/46 days). As a result, the factoring business, with a balance sheet receivables volume of EUR 57.3 million, continued to account for only an immaterial portion of the consolidated balance sheet.
The ratio of income to net acquisition values determines the gross margin of the factoring business. Due to the revolving purchase of receivables and the resulting lower volume, the refinancing requirement is lower than for refinancing leasing new business. The gross margin in the reporting year remained unchanged year-over-year at 1.5 percent (previous year: 1.5 percent).
The new lending business of grenke Bank primarily comprised loans issued under the “Mikrokreditfonds Deutschland” (Microcredit Fund Germany) programme. Through this programme, grenke Bank offers government-sponsored microfinancing of between EUR 1,000 and EUR 25,000. The total lending business of grenke Bank increased in the reporting year by 7.5 percent to EUR 40.6 million (previous year: EUR 37.8 million).
Results of operations
The selected disclosures from the consolidated income statement for the current financial year are explained at the Consolidated Group level and on the basis of the segment results.
Interest and similar income from financing business is dependent on the amount of lease receivables from current contracts. At the beginning of the 2025 financial year, lease receivables from current contracts amounted to EUR 6.5 billion, compared to EUR 5.7 billion at the beginning of the 2024 financial year. By the end of the 2025 financial year, lease receivables had grown to EUR 7.3 billion. As a result, interest and similar income from financing business in the 2025 financial year amounted to EUR 668.6 million, or 16.4 percent higher year-on-year (previous year: EUR 574.3 million). The steady, strong growth in new business from previous years is reflected in the increase in lease receivables and, consequently, in interest income from these lease receivables. As a result of the higher refinancing requirements driven by the higher volume of new business and slightly higher average refinancing interest rates, interest expenses rose by 21.1 percent to EUR 263.5 million (previous year: EUR 217.6 million). Net interest income in the reporting year amounted to EUR 405.1 million, posting a 13.6 percent rise year-on-year from EUR 356.7 million. For more information, please refer to Note 4.1 Net interest income in the notes to the consolidated financial statements.
Selected information from the consolidated income statement
EURk
2025
2024
Change
(%)
Interest and similar income from financing business
668,607
574,348
16.4
Expenses from interest on refinancing and
deposit business
263,460
217,611
21.1
Net interest income
405,147
356,737
13.6
Profit from service business
163,242
146,400
11.5
Profit from new business
65,029
61,080
6.5
Gains (+) / losses (–) from disposals
27,417
11,830
> 100
Income from
operating business
660,835
576,047
14.7
Staff costs
215,226
198,209
8.6
of which total remuneration
175,706
162,593
8.1
of which fixed remuneration
145,553
139,140
4.6
of which variable remuneration
30,153
23,453
28.6
Selling and administrative expenses
124,668
117,889
5.8
of which IT project costs
15,114
14,795
2.2
Total operating expenses
364,583
341,019
6.9
Operating result before settlement of claims and risk provision
296,252
235,028
26.0
Result from settlement of claims and risk provision
– 195,953
– 131,012
49.6
Group earnings before taxes
93,432
89,402
4.5
Group earnings
71,775
70,158
2.3
Earnings per share
(in EUR; basic/diluted)
1.29
1.44
– 10.4
Profit from service business improved by 11.5 percent in the reporting year, reaching EUR 163.2 million (previous year: EUR 146.4 million). The positive development resulted, among other factors, from the high volume of new business in the current and preceding financial years, as well as from the acquisition of the existing portfolio of Intesa Sanpaolo Rent Foryou S.p.A., which is included in our income from operating leases. Profit from new business increased by 6.5 percent in the 2025 financial year to EUR 65.0 million (previous year: EUR 61.1 million), also primarily due to higher new business volumes and the capitalisation of initial direct costs. Gains/losses from disposals amounted to EUR 27.4 million (previous year: EUR 11.8 million), mainly due to gains resulting from proceeds generated from lease assets after the originally agreed lease term through subsequent leases and sales, which were positively influenced by general price increases. A positive impact also stemmed from supply chain disruptions and the resulting delays in new investments. This was due to the fact that, for some customers, extending their expiring lease contract was attractive or simply a more suitable option. This impact was further magnified by the structure of the lease portfolio, which reflects relatively low new business volumes in the years 2020 and 2021 during and immediately after the coronavirus pandemic.
Higher net interest income, the profit from service business, the profit from new business, and gains from disposals, all drove the income from operating business 14.7 percent higher in the 2025 financial year to EUR 660.8 million (previous year: EUR 576.0 million).
Staff costs, which, next to interest and risk items, ranks as one of the Consolidated Group’s three most significant expense categories, increased by 8.6 percent in the reporting year to EUR 215.2 million (previous year: EUR 198.2 million). This increase primarily resulted from the higher number of employees. Employee remuneration consists of two components: a fixed component and a variable component. The fixed remuneration component in the 2025 financial year increased 4.6 percent year-on-year, reaching EUR 145.6 million (previous year: EUR 139.1 million). The variable remuneration component rose by 28.6 percent year-over-year to EUR 30.2 million (previous year: EUR 23.5 million). In the reporting year, a greater emphasis was placed on variable remuneration for first-level management. This follows the emphasis in the 2024 financial year on variable remuneration, which was increased in lieu of an increase in fixed remuneration. The average number of employees (on a full-time-equivalent basis) in the 2025 financial year was 2,331, representing an increase of 6.1 percent compared to the previous year’s average of 2,196 employees.
Selling and administrative expenses increased by 5.8 percent in the 2025 financial year to EUR 124.7 million (previous year: EUR 117.9 million). This was primarily attributable to scheduled increases in licence fees and data line costs incurred as part of the ongoing migration to the cloud under our digitalisation programme. Legal and consulting costs also increased, largely as a result of greater advisory needs related to the sale of the factoring companies as well as the acquisition of franchise companies and the Italian company Intesa Sanpaolo Rent Foryou S.p.A. Lower selling expenses had an offsetting effect.
Depreciation and amortisation remained essentially unchanged at EUR 24.7 million (previous year: EUR 24.9 million).
As a result, total operating expenses amounted to EUR 364.6 million, representing a year-on-year increase of 6.9 percent compared to the previous year’s level of EUR 341.0 million.
The cost-income ratio improved in the 2025 financial year to 55.2 percent (previous year: 59.2 percent), thereby clearly below the full-year target of under 60 percent.
The operating result before settlement of claims and risk provision increased by 26.0 percent to EUR 296.3 million compared to the previous year’s level of EUR 235.0 million.
Expenses for settlement of claims and risk provision deteriorated substantially by 49.6 percent in the 2025 financial year to EUR –196.0 million (previous year: EUR –131.0 million). This item consists of the derecognition of bad debts and impairments for expected losses as risk provisions. This deterioration is due to the persistently difficult macroeconomic environment and the resulting high number of credit defaults and insolvencies in nearly all markets. It is also attributable to our overall higher leasing volume. The determination of expected credit losses is based on a three-level approach in accordance with IFRS 9. If a significant deterioration in the credit risk (Level 2) or an impairment in creditworthiness (Level 3) occurs, a risk provision in the amount of the expected losses over the entire remaining term of the contract must be recognised. For more information on the method for determining the impairment of lease receivables, see the disclosures in Note 5.2 Lease receivables in the notes to the consolidated financial statements. Expenses for losses actually incurred and recognised defaults in receivables from non-performing lease contracts increased to EUR 108.6 million in the 2025 reporting year (previous year: EUR 95.3 million) and are contained in the line item “settlement of claims and risk provision”. The actual losses realised essentially include expenses in connection with the derecognition of receivables, legal costs and income from the sale of items from terminated leases.
Of the total expenses for the settlement of claims and risk provision, EUR 196.1 million (previous year: EUR 137.1 million) was attributable to the Leasing business, EUR 0.5 million (previous year: EUR – 7.3 million) to the Bank’s lending business, and EUR – 0.4 million (previous year: EUR 1.2 million) to the Factoring business, which is currently in the process of being sold. For more information on the composition of this expense item, see Note 4.8 Settlement of claims and risk provision in the notes to the consolidated financial statements.
Development of the loss rate, settlement of claims and risk provision, and volume of leased assets
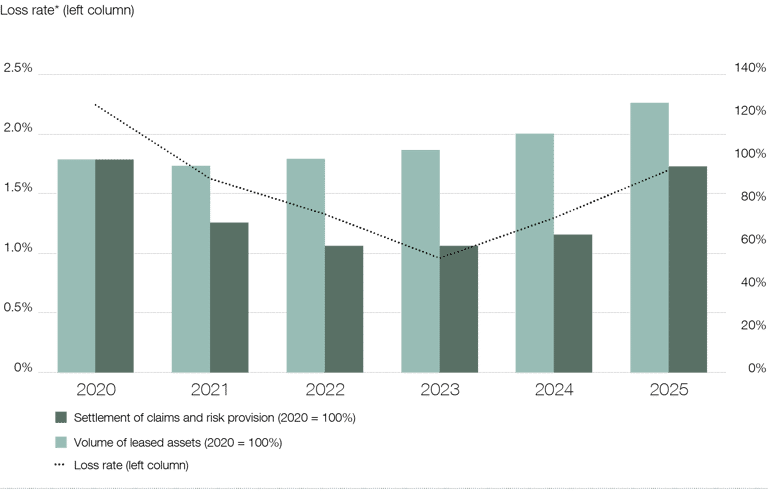
The loss rate (expenses for the settlement of claims and risk provision in relation to the volume of leased assets on the respective reporting date) increased to 1.7 percent in the 2025 financial year (previous year: 1.3 percent). The loss rate was thereby above its average value since 2020 of 1.5 percent. The volume of leased assets (sum of the net acquisition values of all current leasing contracts) increased by 12.9 percent as of December 31, 2025 due to higher new business volume and reached EUR 11,432 million (December 31, 2024:
EUR 10,122 million).
There was no goodwill impairment in the reporting year. In the previous year, EUR 4.4 million in goodwill impairment was attributable to the cash-generating unit related to the leasing business in Spain. This impairment was due to deteriorating return prospects, which among other factors, was attributable to an increase in losses.
Other operating result improved to EUR – 2.6 million (previous year: EUR – 9.6 million). This includes other operating expenses, which increased by 9.8 percent in the reporting year to EUR 19.2 million (previous year: EUR 17.5 million). This increase was primarily attributable to currency translation differences of EUR 2.0 million related to the British pound (GBP), EUR 1.6 million to the Australian dollar (AUD), EUR 1.2 million to Chilean pesos (CLP), EUR 1.1 million to Arab dirhams (AED) and EUR 1.1 million to Polish zloty (PLN). These differences mainly arose from derivative hedging transactions, which balance out economically over the full period. This was partially offset by currency translation recognised directly in equity through other comprehensive income. As this mainly relates to the translation of lease receivables in foreign currency countries, this effect is shown in a different line item than the aforementioned translation effects from derivatives. In addition, lease receivables are translated at the exchange rate on the reporting date, whereas derivatives are measured at fair value based on the forward exchange rates applicable on the reporting date. This difference and the resulting valuation effect balance each other out over the term of the hedging relationships. Other operating income increased in the 2025 financial year to EUR 16.6 million (previous year: EUR 7.9 million), primarily due to the reversal of other provisions as well as prior-period and extraordinary income, which includes, among other items, the deconsolidation result of the Polish factoring company.
The operating result increased by 8.5 percent in the 2025 financial year to EUR 97.7 million (previous year: EUR 90.0 million).
The net of other interest income and interest expenses declined to EUR –1.6 million (previous year: EUR 2.9 million), largely due to lower balances held at central banks as well as the general development of interest rate levels.
Group earnings before taxes grew 4.5 percent in 2025 to EUR 93.4 million (previous year: EUR 89.4 million). The tax rate also increased to 23.2 percent (previous year: 21.5 percent).
Group earnings increased accordingly by 2.3 percent to EUR 71.8 million (previous year: EUR 70.2 million).
The transfer of 17 percent of the shares in Grenke Italia S.p.A., the acquisition of the Italian company Intesa Sanpaolo Rent Foryou S.p.A. and the acquisition of the franchise companies, including the associated increase in the result from non-controlling interests, resulted in a decline in earnings per share to EUR 1.29 in the reporting year (previous year: EUR 1.44).
Segment development
Segment reporting comprises the five reportable segments: DACH, Western Europe (without DACH), Southern Europe, Northern/Eastern Europe, and Other. For further details, please refer to Note 8 Segment Reporting in the Notes to the consolidated financial statements.
The external operating income of the leasing companies, as a whole, developed positively, driven primarily by interest income from the growing new business of past years, as well as improved profit from service business, profit from new business, and gain/losses from disposals.
External operating income from the leasing business increased by EUR 83.7 million to EUR 646.1 million in the 2025 financial year (previous year: EUR 562.4 million), primarily due to the continued positive development of new business and the resulting increase in interest income. A particularly strong increase in absolute figures was recorded in the Southern Europe segment (up 22.5 percent) and in Western Europe (without DACH) (up 11.3 percent). Italy (Southern Europe) and France (Western Europe, without DACH) contributed to this development in particular, with positive performance in net interest income, gains and losses from disposals and the profit from service business. The increase in Italy is attributable to strong growth and the acquisition of the existing portfolio of the Italian company Intesa Sanpaolo Rent Foryou S.p.A., which was included in the scope of consolidation of the grenke Group with effect from June 1, 2025 and merged into Grenke Italia S.p.A. with effect from October 1, 2025.
The segment’s operating selling expenses, consisting of staff costs, selling and administrative expenses, and depreciation and amortisation, increased by 7.5 percent to EUR 344.4 million (previous year: EUR 320.3 million). These expenses are allocated to the segments based on internal cost accounting. An increase was recorded across all segments, with the largest increase in absolute terms attributable to the Southern Europe and Western Europe (without DACH) segments, each up 8.2 percent. The rise is a result of stronger sales activities and, in Italy, to the integration of Intesa Sanpaolo Rent Foryou S.p.A.
The result from settlement of claims and risk provision of the leasing companies deteriorated by 43.0 percent to EUR –196.1 million (previous year: EUR –137.1 million). This development was observed in all segments. The DACH, Southern Europe and Western Europe (without DACH) segments, notably Germany, Italy and France, experienced a deterioration due to persistent macroeconomic challenges, the continued high number of payment defaults and insolvencies, and the risk provisioning associated with increasing new business volumes.
The following table presents the performance of the individual regions:
EURk
2025
2024
Change
(%)
External operating income
DACH
110,310
102,685
7.4
Western Europe (without DACH)
189,994
170,667
11.3
Southern Europe
162,423
132,565
22.5
Northern/Eastern Europe
124,016
108,580
14.2
Other Regions
59,410
47,769
24.4
Operating expenses
DACH
– 74,913
– 70,706
6.0
Western Europe (without DACH)
– 74,650
– 68,983
8.2
Southern Europe
– 83,427
– 77,135
8.2
Northern/Eastern Europe
– 76,986
– 72,160
6.7
Other
– 34,418
– 31,291
10.0
Result from settlement of claims and risk provision
DACH region
– 28,324
– 11,602
> 100
Western Europe (without DACH)
– 60,517
– 46,021
31.5
Southern Europe
– 53,194
– 35,590
49.5
Northern/Eastern Europe
– 33,550
– 27,076
23.9
Other
– 20,537
– 16,845
21.9
Segment result
DACH region
7,073
20,377
– 65.3
Western Europe (without DACH)
54,827
55,663
– 1.5
Southern Europe
25,802
19,840
30.0
Northern/Eastern Europe
13,480
9,344
44.3
Other
4,455
– 367
< – 100
Financial position
At 15.6 percent, the equity ratio remains within our expected range. Our diversified refinancing mix gives us a solid liquidity position. Increasing lease receivables reflect the consistently strong new business growth.
Capital structure
At the grenke Group, we place a particular focus on maintaining an adequate level of liquidity to give us the flexibility to respond to market conditions. Regulatory requirements also require the Consolidated Group to maintain a liquidity buffer.
On the liabilities side of the balance sheet, the rise in total assets was largely attributable to the increase of EUR 772.0 million in financial liabilities to a total of EUR 7.3 billion (December 31, 2024: EUR 6.5 billion), Current and non-current liabilities from refinancing continued to account for the largest share of our financial liabilities, increasing to EUR 5.0 billion compared to the end of 2024 (December 31, 2024: EUR 4.3 billion). Current and non-current liabilities from grenke Bank’s deposit business also increased by EUR 86.2 million to EUR 2.3 billion (December 31, 2024: EUR 2.2 billion).
Current and non-current derivative financial instruments with a negative market value increased to EUR 36.4 million in the 2025 financial year (December 31, 2024: EUR 26.2 million).
As of December 31, 2025, equity recorded a moderate rise to EUR 1.4 billion (December 31, 2024: EUR 1.3 billion). Group earnings generated during the reporting period of EUR 71.8 million was primarily offset by the acquisition of franchise companies in Latvia, Chile and Canada, as well as the deconsolidation of the Polish factoring company (totalling EUR 35.6 million), the payment of a dividend (EUR 17.7 million), the interest payment on hybrid capital (EUR 17.6 million) and costs of EUR 0.6 million related to the issuance of AT1 bonds. These were countered by lower effects from the mark-to-market valuation of hedging instruments under hedge accounting (EUR 4.0 million) and currency translation differences recognised directly in equity (EUR 0.6 million). The transaction with Intesa Sanpaolo S.p.A. (non-controlling shareholder) is also reflected in equity, resulting in a positive effect of EUR 83.0 million from the transfer of 17 percent of the shares in Grenke Italia S.p.A. in exchange for the acquisition of Intesa Sanpaolo Rent Foryou S.p.A. (see Note 6.1.1 in the notes to the consolidated financial statements). As part of the related earn-out agreement, a further EUR 6.0 million was recognised for the delivery of a fixed number of equity instruments upon achievement of the agreed targets. The repayment and reissuance of AT1 bonds in the same amount did not result in any material change in equity.
Due to the stronger rise in total assets relative to equity, the equity ratio decreased to 15.6 percent as of December 31, 2025 (December 31, 2024: 16.2 percent).
EURk
Dec. 31, 2025
Dec. 31, 2024
Change
(%)
Current liabilities
2,975,104
3,466,543
– 14.2
of which financial liabilities
2,696,520
3,198,394
– 15.7
Non-current liabilities
4,695,827
3,403,599
38.0
of which financial liabilities
4,585,130
3,311,214
38.5
Equity
1,418,271
1,323,173
7.2
Total liabilities and equity
9,089,202
8,193,315
10.9
Equity ratio (in percent)
15.6%
16.2%
– 0.6 pp
Cashflow
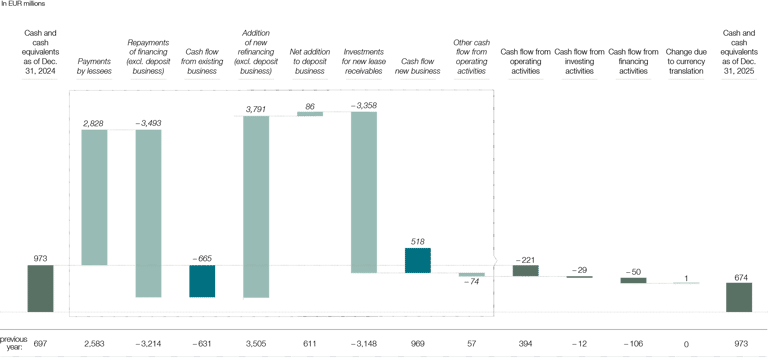
Cash flow from operating activities decreased in the 2025 financial year to EUR – 220.7 million (previous year: EUR 394.0 million). This comprises cash flow from new business, cash flow from existing business and other cash flows from operating activities.
Cash flow from new business includes investments in new lease receivables. These include the net acquisition values of newly acquired lease objects and the costs directly associated with the conclusion of the contract. Due to the higher new business volume, investments in new lease receivables increased in the 2025 financial year to EUR 3,358.4 million (previous year: EUR 3,148.1 million). These were offset by the proceeds from increased refinancing totalling EUR 3,790.6 million compared to EUR 3,505.2 million in the prior year. Additionally, grenke Bank AG’s net deposit business declined to EUR 86.2 million, down from EUR 611.4 million in the prior year. Overall, cash flow from new business decreased to EUR 518.4 million (previous year: EUR 968.5 million).
Cash flow from existing business amounted to EUR – 665.1 million (previous year: EUR – 631.1 million). This was driven by cash inflows from payments made by lessees totalling EUR 2,828.3 million in the 2025 financial year (previous year: EUR 2,583.2 million). These were offset by repayments to refinancing providers of EUR 3,493.4 million (previous year: EUR 3,214.3 million).
Other cash flows from operating activities amounted to EUR – 74.0 million (previous year: EUR 56.5 million).
Cash flow from investing activities totalled EUR – 29.1 million in the 2025 financial year (previous year: EUR – 12.1 million). This includes purchase price payments of EUR 57.2 million for the acquisition of subsidiaries (previous year: EUR 3.6 million). The amount was paid for the acquisition of the companies B2F S.r.l., Selfrent S.r.l., GC Leasing Norway AS, GC Rent Chile SpA, SIA GC Leasing Baltic, GC Crédit-Bail Québec Inc., GC Leasing Ontario Inc., GL Leasing British Columbia Inc. and GWFACT – Invoice Solutions, Lda. These were partially offset by cash inflows of EUR 46.8 million from the acquisition of subsidiaries (previous year: EUR 0.0 million), resulting from the assumption of existing cash balances. Payments for the acquisition of property, plant, and equipment and intangible assets totalled EUR 18.8 million (previous year: EUR 8.6 million). The increase was primarily attributable to the purchase of an investment property. Additionally, this item included proceeds of EUR 0.1 million from the sale of property, plant, and equipment and intangible assets (previous year: EUR 0.1 million).
Cash flow from financing activities amounted to EUR – 50.3 million in the 2025 financial year (previous year: EUR –105.5 million), representing an increase of EUR 55.2 million. Unlike the previous year, no treasury shares were repurchased in financial year 2025 (previous year: EUR 55.6 million). The dividend payment for the 2025 financial year amounted to EUR 17.7 million, compared to EUR 21.6 million in the previous year. Interest payments on hybrid capital amounted to EUR 17.6 million (previous year: EUR 15.0 million). Additionally, the repayment of lease liabilities resulted in a cash outflow of EUR 13.8 million (previous year: EUR 13.3 million). A net cash outflow of EUR 1.2 million also arose in connection with the new issue of an AT1 bond and the repurchase of previously issued AT1 bonds (previous year: EUR 0 million).
As a result, total cash flows in the 2025 financial year amounted to EUR – 300.1 million (previous year: EUR 276.4 million). After the consideration of currency translation differences of EUR 0.7 million (previous year: EUR 0.1 million), cash and cash equivalents as of December 31, 2025 decreased to EUR 674.0 million, compared with EUR 973.4 million at the end of the previous year.
Cash flow statement
Liquidity
Thanks to our diversified refinancing structure, we met our payment obligations at all times during the past financial year.
In the third quarter of 2025, a fourth pillar, “External Bank Funding”, was introduced to enhance transparency and clarity as a result of its growing importance. Debt financing is thus essentially based on four pillars: senior unsecured instruments, which primarily rely on our rating, such as bonds and commercial paper; the deposit business of grenke Bank AG; receivables-based financing, primarily asset-backed commercial paper (ABCP) programmes; and external bank funding, which mainly comprises debt instruments (promissory notes, revolving facilities, money market transactions and current accounts). To the greatest extent possible, we finance ourselves on a maturity-matched basis at portfolio level, thereby minimising interest rate risk, refinancing risk and maturity transformation at portfolio level. Thanks to our broad refinancing mix, we can utilise the individual pillars in a targeted manner and expand or reduce the share depending on requirements and the market situation. At the same time, we want to be active in all four pillars for strategic reasons.
The refinancing mix describes the utilisation of the grenke Group’s refinancing pillars and was distributed as follows:
EURm
Dec. 31, 2025
Share in %
Dec. 31, 2024
Share in %
Deposit business of grenke Bank
2,288
31.2
2,201
33.4
Senior unsecured
3,143
42.9
2,697
41.0
Asset-backed
1,208
16.5
1,244
18.9
External bank funding
687
9.2
438
6.7
Total
7,326
100
6,580
100
The increase of EUR 760.1 million in refinancing volumes to EUR 7,340.0 million (December 31, 2024: EUR 6,579.9 million) was mainly attributable to higher new business and the resulting increased refinancing requirements for our leasing business. This was largely funded by our issue of two new benchmark bonds of EUR 500 million each in the second and third quarters.
Refinancing via customer deposits at grenke Bank AG amounted to EUR 2,288.2 million as of December 31, 2025, compared to EUR 2,200.9 million at the end of 2024, representing a rise of 4.0 percent.
During the reporting period, two new EUR benchmark bonds were issued and, for the first time, an AUD bond with a nominal volume of AUD 125 million was placed, underlining our focus on Australia as one of our future core markets. In addition, two existing bonds were increased by an aggregate total of EUR 125.0 million. Alongside the scheduled bond repayments made during the reporting year, a voluntary early partial redemption of bonds with a total nominal volume of EUR 11.5 million was also carried out. Further information on the debt securities is provided in Note 5.12 of the notes to the consolidated financial statements and is available on our website at www.grenke.com/en/investor-relations/debt-capital/issued-bonds/.
As part of the integration of Rent Foryou S.p.A. into the Consolidated Group, four new loans with a total nominal volume of EUR 212.1 million were added. In addition, a syndicated loan of EUR 50.0 million was issued. The promissory notes were repaid as scheduled during the reporting year.
A syndicated revolving credit facility with a volume of EUR 400,000k also remains in place (drawdowns can be partially made in Swiss francs and British pounds). The credit facility is subject to a term of three years with an extension option of a further two years.
Further information on the refinancing instruments and the refinancing measures implemented during the reporting period is provided in the notes to the consolidated financial statements under Note 5.12 Current and non-current financial liabilities.
The Consolidated Group’s unutilised credit lines (i.e. bank lines plus available bond volumes) amounted to EUR 2,931.3 million, HUF 500.0 million and PLN 10.0 million as of the reporting date (December 31, 2024: EUR 3,323.1 million, HUF 540.0 million and PLN 40.0 million).
We use various refinancing instruments and stagger their maturities over several periods. This allows the Consolidated Group to react flexibly to changes in the refinancing markets. The table below shows the expected cash outflows resulting from the contractual obligations existing as of December 31, 2025. Of the total financial debt of EUR 1.4 billion due in 2025, EUR 507.1 million is attributable to liabilities from ABCP programmes and EUR 871.8 million to bonds, debentures and private placements. Details of the maturities of the individual instruments are provided in the notes to the consolidated financial statements under Note 5.12 Current and non-current financial liabilities.
The grenke Group’s off-balance sheet obligations totalled EUR 1,075.9 million as of December 31, 2025 (previous year: EUR 1,030.1 million). In addition to the usual purchase obligations in the course of ordinary business activities, these include irrevocable loan commitments and obligations from pending transactions. Leasing and rental agreements are only off-balance sheet to the extent that a lease liability does not have to be recognised in accordance with IFRS 16. Further details on off-balance-sheet obligations are provided in the notes to the consolidated financial statements under Note 9.2 Contingent liabilities and other financial obligations.
Expected cash outflows from contractual obligations
Obligations as of
Maturity of the obligation as of Dec. 31, 2025
Maturity of the obligation as of Dec. 31, 2025
Maturity of the obligation as of Dec. 31, 2025
Maturity of the obligation as of Dec. 31, 2025
Obligation as of
EURk
Dec. 31, 2025
1 to
3 months
3 months
to 1 year
1 to
5 years
More than
5 years
Dec. 31, 2024
Financial liabilities
5.822.436
589.801
838.126
4.389.371
5.138
5.060.165
ABCP-related liabilities (denominated in EUR)
994.521
108.061
290.646
593.838
1.976
1.082.434
ABCP-related liabilities (not denominated in EUR)
330.750
28.337
80.043
219.217
3.153
298.437
Bonds, debentures, private placements (denominated in EUR)
3.909.887
376.586
323.006
3.210.286
9
3.161.319
Bonds, debentures, private placements
513.236
58.682
113.495
341.059
0
423.131
(not denominated in EUR)
10.900
1.575
4.725
4.600
0
5.300
Sales of receivables agreements (denominated in EUR)
51.830
9.842
24.808
17.180
0
70.236
Sales of receivables agreements
11.312
6.718
1.403
3.191
0
19.308
(not denominated in EUR)
305.000
17.500
0
70.000
217.500
244.562
Payments related to bank liabilities
41.429
3.761
9.689
22.961
5.018
54.704
Hybrid bond
143
143
0
0
0
6.968
Leases and rentals
1.050.743
788.832
261.911
0
0
1.003.986
Irrevocable credit commitments
12.287
2.800
4.431
5.012
44
6.386
Purchase obligations1
7.232.038
1.402.837
1.114.157
4.487.344
227.700
6.376.771
1 The obligations include those payment obligations that the Consolidated Group cannot avoid even if it exercises contractual termination options. Legally binding obligation to accept goods and services and trade payables.
Net assets
Compared to the end of the 2024 financial year, our total assets increased 10.9 percent to EUR 9.1 billion as of December 31, 2025 (December 31, 2024: EUR 8.2 billion).
The increase in our total assets as of December 31, 2025 was mainly attributable to the increase in current and non-current lease receivables. The steady positive new business drove lease receivables, our largest balance sheet item, higher by EUR 825.7 million to EUR 7.3 billion compared to the end of the 2024 financial year (December 31, 2024: EUR 6.5 billion). For further details on the development of lease receivables in the 2025 financial year, please refer to Note 5.2 Lease receivables in the notes to the consolidated financial statements.
Cash and cash equivalents totalled EUR 674.1 million as at December 31, 2025 (December 31, 2024: EUR 974.6 million), representing a planned decrease while remaining at a solid level. Of this amount, EUR 549.2 million (December 31, 2024: EUR 790.7 million) was held in accounts with the Deutsche Bundesbank as at December 31, 2025.
The increase in other current and non-current financial assets to EUR 223.0 million (December 31, 2024: EUR 181.8 million) is primarily attributable to higher loans to companies in connection with the sale of factoring companies and an increase in receivables from refinancing providers.
Within non-current assets, property, plant and equipment increased by EUR 135.5 million to EUR 233.9 million (December 31, 2024: EUR 98.4 million). This was mainly driven by the acquisition of the existing business and the associated leased assets from operating lease contracts of Intesa Sanpaolo Rent Foryou S.p.A. Other intangible assets increased to EUR 38.2 million (December 31, 2024: EUR 9.8 million) as a result of the capitalisation of assets in connection with the purchase price allocation for the acquired companies Selfrent S.r.l., B2F S.r.l. and Rent Foryou S.p.A. Goodwill also increased significantly as a result of the acquisitions to EUR 115.2 million (December 31, 2024: EUR 30.0 million). For further details, please refer to Note 5.8 Intangible assets in the notes to the consolidated financial statements.
EURk
Dec. 31, 2025
Dec. 31, 2024
Change
(%)
Current assets
3,694,708
3,980,428
– 7.2
of which cash and cash equivalents
674,092
974,551
– 30.8
of which lease receivables
2,489,734
2,594,088
– 4.0
Non-current assets
5,394,494
4,212,887
28.0
of which lease receivables
4,852,193
3,922,154
23.7
Total assets
9,089,202
8,193,315
10.9
Overall statement on the Consolidated Group’s business performance and position
The 2025 financial year was again challenging, as global geopolitical tensions intensified and politics and the economy faced significant, in some cases unpredictable developments, particularly in U.S. policies. Against the backdrop of moderate economic momentum in the euro area and low inflationary pressure, the European Central Bank initially continued its monetary policy easing and reduced the benchmark rate from 3 percent to 2 percent in the first half-year, subsequently maintaining it at this level.
Despite ongoing macroeconomic uncertainty throughout the financial year, we achieved growth in leasing new business in every quarter as planned, continuing the growth trajectory of the previous years. With approximately EUR 3.3 billion in leasing new business, we remained within our target range. Alongside the growth in leasing volume, profitability remained a key priority. With a resulting CM2 margin of 16.7 percent, we met our forecast to exceed 16.5 percent for the CM2 margin in 2025 (previous year: 17.0 percent).
The portfolio’s quality remained high overall in the 2025 financial year. However, the continued rise in economy-wide insolvencies continued to drive an increase in payment defaults.
As a result, the loss rate rose from 1.3 percent in 2024 to 1.7 percent in the reporting year, exceeding the long-term average of 1.5 percent.
To refinance our ambitious growth objectives, we successfully issued two additional benchmark bonds in the reporting year, each with a volume of EUR 500 million, in May and September 2025.
In September 2025, S&P Global Ratings confirmed our investment grade rating of BBB/stable/A-2. Fitch Ratings reaffirmed its investment grade rating of BBB/stable/F2 in June 2025. Based on a solid equity ratio of 15.6 percent at the end of 2025 and traditionally well-diversified refinancing options, the Board of Directors is confident in the Group’s ability to continue to finance its planned growth in leasing new business at market conditions in the coming year.
Download Management Report
Download the full management report here.
Downloads
Reports & Presentations
Find out more about our reports here.
Save the date now! Calendar 2026
Stay up to date and meet us at an event.

Always stay tuned
You have questions? We have the answers. Get in touch with us or sign up for our IR newsletter.


