 grenke around the globe

Please note that this website shows an excerpt from the grenke AG Annual Report 2025. The annual report, which is also available in the “Reports & Key Figures” section of the grenke AG website, prevails.
Group fundamentals

grenke at a glance
We are a global financing partner for companies, institutions, and the public sector in the small-ticket segment. Through our solutions, we give our lessees financial flexibility when realising their investments. Customers who lease through us can preserve their liquidity. We operate in line with our values: simple, fast, personal, and entrepreneurial. Founded in 1978 in Baden-Baden, we were operating in 31 countries around the world at the end of 2025, with more than 2,400 employees spanning Europe, North and South America, and Australia. grenke AG is the parent company of the grenke Group, comprising 59 subsidiaries (as defined by Section 290 HGB and IFRS 10). The management of grenke AG is the responsibility of the Board of Directors, which comprised four members at the end of the 2025 financial year and is based at the Company’s headquarters in Baden-Baden, Germany. At the end of the 2024 financial year, Chief Risk Officer Isabel Rösler left grenke AG, leaving the Board of Directors with just three members from January 1, 2025 to August 31, 2025. Following the appointment of Isabel Tufet Bayona as Chief Operating Officer on September 1, 2025, the Board of Directors once again comprised four members. As stipulated in the Articles of Association, the Company’s Supervisory Board consists of six members.
Countries
Active specialist reseller partners
Customers
Leasing contracts
Business model and segmentation
In our core leasing business, we generated 97.5 percent of the Consolidated Group’s interest income in the reporting year (previous year: 96.8 percent). We are a specialist in small-ticket leasing for contracts with volumes up to EUR 50,000. Contracts of this size accounted for 96.5 percent (previous year: 97.1 percent) of all lease contracts during the reporting year. Our range of leasing services includes financing for commercial customers, rental, service, protection and maintenance offerings, as well as the remarketing of returned leased objects. We provide financing solutions for a broad range of products to meet our customers’ needs as comprehensively as possible. In the 2025 financial year, our new leasing contracts were distributed across the following product categories:
- IT (28.0 percent), including computers, laptops, servers, and peripheral devices
- Photocopy equipment (20.4 percent)
- Green economy (15.6 percent), including eBikes, solar installations, and wallboxes
- Machinery and equipment for manufacturing (15.7 percent)
- Communication technology (8.9 percent), such as mobile phones
- Medical technology (4.8 percent)
- Security devices (3.9 percent)
- Office equipment (2.2 percent)
- Others (0.6 percent), which includes various objects from drones to forklifts
Almost all of our lease contracts are full amortisation contracts. By adjusting our acceptance policy, we are able to manage our leasing new business with agility in terms of both volume and quality. For example, during periods of economic weakness we focus strictly on lower-risk, new business by refraining from business with higher-risk industries and customer segments. We also have the flexibility to adapt our terms and conditions to prevailing market developments and macroeconomic conditions. As a result, we succeeded in achieving risk-appropriate margins and operating on a sustainably profitable basis both during the financial crisis in 2009 and during the COVID-19 pandemic in 2020 and 2021.
The diversification of all critical business activities represents the strategic foundation for strengthening our resilience. This includes our broad product portfolio, the diversification of our customer base across industries, countries, risk classes, and individual investment volumes, our extensive network of specialist reseller partners, as well as our refinancing.
In addition to the leasing business, we also operate grenke Bank. grenke Bank offers fixed term deposit products to private and commercial customers via its own website and established online platforms. By way of these customer deposits, grenke Bank plays an important role in refinancing the Consolidated Group by purchasing the Group’s lease receivables and granting it loans. In the 2025 financial year, the deposit business accounted for 31.8 percent of the Consolidated Group’s financial liabilities (previous year: 34.2 percent). Refinancing via grenke Bank’s deposit business made up 18.9 percent of total interest expenses (previous year: 16.7 percent), highlighting both the attractiveness and strategic importance of this refinancing pillar for the grenke Group. In addition, grenke Bank acts as a financing partner to small and medium-sized enterprises (SMEs), offering them a range of additional financial services. Through partnerships with various federal and state development banks, grenke Bank also provides development loans to SMEs and self-employed professionals who use leasing to finance new business acquisitions. The Bank’s business focuses primarily on German SMEs, with core operations centred on microcredit lending under the Microcredit Fund Germany (Mikrokreditfonds Deutschland) programme.
In April 2025, we announced the sale of our factoring business unit to Teylor AG. The sales process is taking place in stages and is expected to be completed by mid-2026. Consequently, factoring accounted for 1.7 percent of the Consolidated Group’s interest income in the 2025 financial year.
Details on the segment business development during the reporting year can be found in Chapter 2.6 Results of operations, under the segment entitled “Segment performance” of the combined management report , and in Chapter 8 Segment reporting of the notes to the consolidated financial statements.
Sales markets and market position
At the end of the 2025 financial year, our leasing business was operating in 31 countries across five continents, with a total of 125 locations. We review and optimise our location network on a continual basis. Our operations are primarily focused in Europe, where we operate in all of our key leasing markets. Outside Europe, we have established locations in Australia, North and South America, and in Asia, including the United Arab Emirates. In the 2025 financial year, we generated 92.8 percent (previous year: 93.6 percent) of our leasing new business in Europe.
No public market studies for the small-ticket leasing segment for full-year 2025 were available at the time of preparing this report. According to the European leasing association Leaseurope, the volume of the European leasing market overall grew 2.2 percent during the first half of 2025. This growth however occurred primarily in the vehicle and real estate segments. The equipment leasing market, the segment in which grenke operates, saw a volume decline of 8.7 percent and accounted for 24 percent of the total market. It is important to note that the small-ticket leasing business accounts for only a portion of the overall market. According to Leaseurope, the markets most relevant to grenke – Italy (+12.9 percent) and the United Kingdom (+3.9 percent) – achieved growth in equipment leasing, while business volumes declined in Germany (– 37.5 percent), Spain (– 11.0 percent), and France (– 9.5 percent). Our 7.8 percent growth in new leasing volume over the past year demonstrates that grenke gained market share across Europe.
In our home market of Germany, the German Leasing Association (BDL) paints a similar picture. The BDL’s 2025 Annual Report, which analyses the 2024 financial year, shows that the German leasing market continues to be dominated by vehicles (passenger cars, commercial vehicles, aircraft, rail vehicles, and watercraft). The object categories that are particularly relevant for grenke – IT, software/cloud, other equipment, medical technology, bicycles, and eScooters – represent a market volume of approximately EUR 8 billion, corresponding to around 10 percent of the total market (new business across all investment and ticket sizes).
Our customer structure has remained stable for many years: The service sector remains by far our largest customer group, followed by the manufacturing industry. Although the public sector accounts for just 2 percent of volume, it recorded the strongest growth at 24 percent.
More than half of leasing transactions in Germany (56 percent) are concluded via dealers or manufacturers. Direct sales account for 31 percent of leasing new business, while banks and intermediaries have declined significantly (26 percent and 22 percent, respectively). Internet-based transactions remain marginal at under 1 percent; personal consultation continues to play a central role, with digital services providing only supplementary support.
For the first half of 2025, the BDL presented a mixed picture for the German market: While the number of new contracts fell by just under 4 percent, order volumes rose by around 2 percent. Passenger cars and station wagons (up 6.9 percent) were again growth drivers, along with increased, albeit still modest, demand for medical technology and equipment for renewable energy. This is in contrast to orders for traditional capital goods such as machinery, construction equipment, and agricultural technology as well as bike leasing, which declined sharply, pointing to subdued investment activity in the industrial, construction, and agricultural sectors. The hoped-for recovery failed to materialise in the second quarter, but a BDL sample survey in the third quarter showed a slight year-on-year increase of 4.8 percent.
Alongside Germany, our core markets of France and Italy are the most important contributors to new business volume.
European markets are predominantly served by local providers, in particular leasing subsidiaries of large banks and capital goods manufacturers. However, many of these competitors are not as consistently focused on small-ticket leasing as we are. Their range of offers tends to be broader and aimed at higher-ticket segments, such as vehicle or aircraft leasing. Across markets, we view BNP Paribas, DLL, and Crédit Mutuel as the key competitors in our landscape.
The French leasing market is strongly dominated by bank-affiliated firms and features a relatively concentrated provider structure. According to a recent 2025 market study by Exaegis on the competitive landscape in tech small-ticket leasing, we are one of the largest providers in France, alongside BNP Paribas Leasing Solutions, Crédit Mutuel, Loxam, and Crédit Agricole, and are the largest bank-independent provider. Focusing on equipment leasing, Exaegis reported a 0.1 percent decline in overall market volume, while the small-ticket segment grew by 1.8 percent. France continues to be a structurally large and relevant market for small-ticket leasing, despite fluctuations in the broader economy.
In Italy, we have built a strong market position in recent years, particularly in leasing segments with purchase volumes below EUR 50k. According to the latest data from the Italian leasing association Assilea, the market volume for operating equipment leasing declined slightly in 2025. Even so, we were able to further strengthen our leasing new business and our market position in this segment and hold a leading position.
Our strategic partnership with Intesa Sanpaolo, formed in the 2025 financial year, will be a key driver of continued growth and further expansion in the Italian market.
Growth strategy
Our growth strategy focuses on increasing penetration in our existing market regions. To achieve this, we have developed location and hub structures that expand our network of specialist reseller partners and enable the acquisition of new customers. We are also growing through our wholly owned subsidiaries and new locations. As part of this strategy, we opened our second branch in the U.S. – the world’s largest leasing market – in 2024 in Chicago, Illinois, as a wholly owned subsidiary.
Alongside our growing operating business, the Consolidated Group has also made some targeted strategic investments and partnerships in recent years. In January 2025, we announced a strategic partnership with Intesa Sanpaolo in Italy. As part of the collaboration, Intesa Sanpaolo Rent Foryou S.p.A., a subsidiary of Intesa Sanpaolo, was fully contributed into grenke Locazione S.r.l., a subsidiary of grenke AG. In return, Intesa Sanpaolo received a 17 percent equity stake in GRENKE Locazione S.r.l. Under this partnership, we began a commercial collaboration with Intesa Sanpaolo’s branch network and its 1.2 million business customers, along with an agreement to jointly refinance the leasing new business in Italy.
In the first half of 2025, grenke also acquired full ownership of the Italian B2F Group, which specialises in digital platforms using a pay-per-use model.
grenke AG additionally holds a 25.96 percent stake in Miete24 P4Y GmbH, based in Velten, Germany. Miete24 offers more than 10,000 IT products for lease through its fully digitalised online platform.
Business processes and services
In the leasing business, our value added comprises different steps in the process, from liquidity procurement for the initial investment need to fast decision-making in handling lease applications, the operational processing of object purchases, as well as long-term lease contract management to the disposal or continued use of used objects. Our value chain can also be found in greater detail in Chapter 3.2 ESRS 2 Sustainability strategy.
grenke value chain

We primarily utilise two sales channels: dealer sales via our network of specialist reseller and cooperation partners, and direct business, in which we approach customers directly, including through our online business.
In the area of dealer-based sales, we work with specialist reseller partners. Supported by our employees in local sales offices, these partners offer end customers financing solutions for the acquisition of leased assets. Our specialist reseller partner network generates a multiplier effect and forms the foundation for the further scaling of our business model in our markets. We maintain a highly diversified base of customers, resellers, and object portfolios in an effort to avoid concentration risk.
As part of direct sales, we offer some lease solutions to customers independently of manufacturers and specialist resellers. This allows us to integrate our existing network of specialist reseller partners while leveraging the flexibility of direct customer engagement and retention. In the reporting year, the percentage share of our direct sales, based on the number of contracts, declined slightly from 11.6 percent in 2024 to 9.6 percent.
In both sales channels, we are accelerating the digitalisation of our offering in order to realise efficiency gains in external and internal processes. One example is the approximately 130,000 leasing contracts that were processed fully digitally using our proprietary eSignature process. This represents an increase of 0.4 percentage points compared with the previous year.
Targets and strategy
As a leading leasing partner for businesses, institutions, and the public sector, we aim to make leasing a seamless and natural solution for small-scale investments. Leasing is designed to be the best choice for our customers, offering a convenient solution that is fast, as digital as possible, and at the same time personal. We focus on small investment amounts, primarily up to and including EUR 50k, and aim to be a leader in this segment across all our markets. Since our IPO in 2000, we have grown our leasing new business by an average of 12 percent annually, significantly outpacing the average annual growth of the global leasing market as a whole.
For the 2026 financial year, the Board of Directors is prioritising profitability, with a continued focus on sustainable volume growth. The Board primarily measures profitability by the increase in the return on equity.
Despite the volatile macroeconomic and geopolitical environments and the related uncertainties, particularly the development of insolvency trends and the potential related fluctuations in the loss rate, grenke expects Group earnings to increase in the 2026 financial year compared with the previous year. In consideration of the measures planned to enhance efficiency, the Board of Directors anticipates a cost-income ratio of around 55 percent.
Based on current economic forecasts and market data, and with a clear focus on profitability, the Board of Directors expects leasing new business to grow to EUR 3.4 to 3.6 billion and is targeting an increase of 10 percent in leasing new business, with a contribution margin 2 (CM2) of at least 16.5 percent for the full year. Based on the anticipated development of Group earnings, grenke is planning with an equity ratio of approximately 15 percent (December 31, 2025: 15.6 percent), thereby meeting both regulatory and rating requirements. This figure serves as a benchmark rather than a strict capital management threshold for the Group. In the long term, the Board of Directors aims to achieve an after-tax return on equity of over 10 percent by 2030.
To achieve our new business growth targets, we are concentrating on the four core areas described below, each supported by dedicated strategic measures. Managing our liquidity and related refinancing will also continue to play a key strategic role.
Customer- and market-focused activities
We are committed to optimising our regional and national presence in a way that meets market needs and aligns with our business model, as maintaining close relationships with our specialist reseller partners and leasing customers remains central to our brand identity.
We rely on new digital solutions and modern concepts, such as mobile working, to enable efficient and personal communication with all our stakeholders.
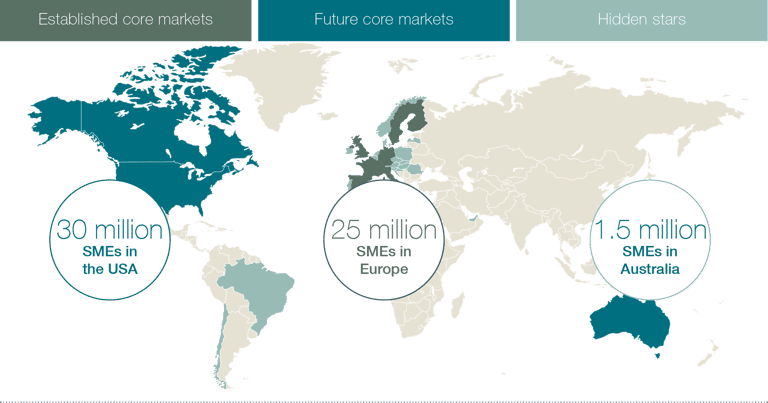
As part of our market strategy, we have defined three expansion clusters, each with its own market approach:
Established Core Markets
Our largest, most established markets. We want to grow in this segment through further product diversification and consistently high market penetration. We plan to focus on strengthening our direct customer approach alongside our traditional reseller-based sales approach.
Germany, Finland, France, Italy, the Netherlands, Sweden, Switzerland, Spain, the United Kingdom
Future Core Markets
Our markets with a strong growth outlook. Here, we invest in tapping into significant market potential through the consistent development and expansion of customer and partner relationships. In the first few years, IT and office equipment are typically the most important object categories.
Australia, Canada, and the U.S.
Hidden Stars
This segment encompasses our smaller and newer markets that make a solid contribution to our revenue. We intend to maintain our profitable position here and are expanding our existing reseller networks and established customer relationships.
Belgium, Brazil, Chile, Denmark, Ireland, Croatia, Latvia, Luxembourg, Norway, Austria, Poland, Portugal, Romania, Slovenia, Hungary, and the United Arab Emirates
Our global market potential
We also continuously monitor our markets for profitability and explore measures to strengthen our position. These range from leveraging synergies through multi-country hub structures to individual optimisation initiatives, and where appropriate, the discontinuation of unprofitable ventures. Consequently, we decided last year to exit the loss-making factoring business and concentrate on our leasing business.
Our sales organisation maintains a broad network of over 34,500 specialist reseller partners as well as contractual relationships with over 716,000 customers worldwide. We continue to intensify our direct sales efforts, particularly in our established markets, while strengthening our specialist reseller network through innovative object categories and ongoing digitalisation. Strategic partnerships, such as the collaboration with Intesa Sanpaolo launched in the Italian market in January 2025, also provide strong support for direct sales in key core markets.
The continued investment requirements of our target customer group, particularly in the areas of digitalisation, automation, and the green economy, offer growth opportunities across all our markets. Together with our business partners, we continuously enhance our portfolio with leasable objects and usage-based contract models that align with both current and future investment plans of businesses, self-employed professionals, and public sector institutions.
Operational excellence and disciplined cost management
Our business model, focused on small-scale investments by businesses, institutions, and the public sector, has enabled us to build a large number of business relationships with specialist reseller partners and leasing customers. We aim to manage this highly diversified portfolio cost-efficiently throughout the entire contract lifecycle. We therefore continually analyse and optimise our core operational processes, starting with instant decision-making and seamless contract finalisation to fully data-driven, digital execution.
We aim to further strengthen and improve our high level of cost efficiency, which is made possible by the strong standardisation of processes used to manage over one million active lease contracts and more than 716,000 active customer relationships – our “bulk business”.
At the same time, we are committed to continuously increasing efficiency when initiating business and in all transactions with our leasing customers and specialist reseller partners, as well as with our internal transactions, and across our processes.
Digital excellence and automation
We are continuously improving our business processes and working to fully automate and digitalise them wherever it makes sense to do so. Our approach is centred on strong customer centricity and designing the optimal customer journey. We aim to minimise complexity for our target group by offering simple solutions that can be integrated as seamlessly as possible. We want our customers’ leasing experience to feel as effortless as possible, fully in line with the pay-per-use model. Our mission is to make the entire leasing process feel as intuitive and seamless as online shopping. The aim is to create a tailored blend of digital processes and personal customer engagement, while harnessing the speed and efficiency of digitalisation in sales to drive operational excellence.
Our focus includes modern payment and contract models, such as usage-based contract models, and the expansion of use cases for eContracts. To execute on these priorities efficiently, we rely on our in-house IT service provider, grenke digital GmbH.
Onboarding and a proper know-your-customer (KYC) process are also part of an optimised digital customer journey, especially in our small-ticket, high-volume business. The use of artificial intelligence (AI) and data-based algorithms can help us gather the right relevant data in an integrated, automated manner. With this approach, we aim not only to enhance our service offering for customers but also to optimise our internal processes and cost efficiency. Further details on grenke’s use of AI can be found in Chapter 1.4 Research and development.
Sustainability in our value chain
Sustainability is an integral part of our corporate strategy. In harmony with the United Nations Sustainable Development Goals and the 2030 Agenda, we have developed a clear vision and a dedicated sustainability strategy, with targeted measures across the Consolidated Group’s own value chain.
This includes aligning all of our business and corporate activities along the dimensions of “climate and environment” (Environmental), “social contribution” (Social) and “responsibility and trust” (Governance), or ESG for short. At the heart of our approach is the goal of enabling customers to finance sustainable investment projects and business models.
Another key element of this strategy involves expanding our portfolio with innovative object categories to unlock new market potential. These categories include objects for advancing digitalisation as well as leased assets for the expansion of a sustainable and overall resource-friendly economy. The reuse and recovery of used leased objects in line with a sustainable circular economy remains a central priority.
We measure our leasing business’s sustainability contribution using the grenke Sustainability Index (GSI), a proprietary ESG metric we developed in-house. To support our refinancing, we also make use of sustainability-linked funding instruments. These include our special bond issues such as the EUR 500 million green bond 2023, which we use exclusively to finance objects in the green economy, and our EUR 500 million social bond 2024, which funds investment projects by small and medium-sized enterprises in EU countries with above-average unemployment.
Management system
Financial performance indicators
The Board of Directors uses the following financial performance indicators to manage the Consolidated Group and evaluate its business development:
Group earnings
The Consolidated Group’s profit after tax for the reporting period.
Leasing new business
Leasing new business is defined as the total acquisition cost in euros of all newly concluded lease contracts for a specific period. It shows the development of the leasing portfolio over a defined period (quarter/year). Leasing new business is the source of future income.
Equity ratio
Equity as a percentage of the total assets on the balance sheet. Maintaining a solid equity ratio and meeting regulatory capital requirements form the foundation for securing an investment grade rating — a key factor in accessing capital market refinancing.
Cost-income ratio (CIR)
Ratio of the sum of operating expense items (staff costs, depreciation and amortisation, selling and administrative expenses) to the sum of income items (operating income before settlement of claims and risk provision). CIR is an indicator of cost efficiency.
Loss rate
The ratio of expenses for the settlement of claims and risk provision for a certain period to the lease volume on the period’s closing date. It reflects the performance of the leasing portfolio in the reporting period.
Contribution margin 2 (CM2 margin)
The ratio of the discounted operating income of all newly concluded lease contracts over the total period (entire term) to the net acquisition value of all new lease contracts within a period. This indicator shows the projected profitability of the newly concluded leasing portfolio.
Development of financial performance indicators
Guidance 2025
2025
2024
2023
Group earnings (in EUR millions)
71– 81
71.8
70.2
86.7
Leasing new business (in EUR billions)
3.2 – 3.4
3.3
3.1
2.6
Assumptions
Equity ratio1
ca. 16%
15.6%
16.2%
19.1%
Cost-income ratio (CIR)
< 60%
55.2%
59.2%
59.2%
Loss rate2
ca. 1.6%
1.7%
1.3%
1.0%
CM2 margin
> 16.5%
16.7%
17.0%
16.5%
1 Adjustment in accordance with IAS 8 (see Note 2.3 of the notes to the consolidated financial statements).
2 With the publication of the Quarterly Statement Q3 and Q1—Q3 2025 on November 13, 2025, the Board of Directors added that with a loss rate of just under 1.8 percent, the lower end of the guidance range for Group earnings is likely to be achieved.
Performance indicators Leasing
Performance indicators Leasing
Unit
2025
2024
2023
CM1 margin
Percent
11.8
11.2
9.8
CM2 margin
Percent
16.7
17.0
16.5
Net acquisition value (NAV)
EURm
3,295
3,057
2,581
Expected loss/NAV
Percent
6.2
6.0
5.1
Embedded value1
EURm
1,608
1,519
1,489
Return on equity after tax
Percent
5.2
5.2
6.5
1 Previous years’ figures adjusted, as hybrid capital is not included in the calculation.
In addition to the abovementioned Consolidated Group performance indicators, other performance indicators are also applied to the leasing business:
- Contribution margin 1 and 2
- Net acquisition value (NAV)
- Expected loss
- Embedded value
- After-tax return on equity (RoE)
To evaluate and manage the profitability of our leasing new business, and thereby the effectiveness of our sales activities, we calculate contribution margins that reflect the income generated over the full term of each lease contract. In the leasing business, a distinction is made between contribution margin 1 (CM1), or the CM1 margin (contribution margin 1 in relation to new business), and contribution margin 2 (CM2), or the CM2 margin. CM1 corresponds to the present value of the net interest income of a lease contract less the commission paid to third parties. CM2 represents the present value of the operating income of a leasing contract, including risk costs, as well as service and disposal income. Both figures relate to the total period of a lease contract and therefore take into account the four-year average lease term starting from the conclusion of the contract. In managing new business, the focus is primarily on the CM2, whose calculation corresponds to operating income, excluding the result from claims settlement and risk provisioning. While the contribution margin is determined by the leasing new business of the past reporting period, the operating income from the concluded lease contracts is distributed over their average term of four years. The operating income and Group earnings for the financial year are also determined by the new business acquired in previous financial years.
The expected credit loss corresponds to the initially calculated and expected amount of loss over the full term of a lease contract or a portfolio. Our goal is to minimise the deviation between expected and actual losses incurred during the contract term.
Embedded value represents the present value of all outstanding instalments and expected gains/losses from disposals after costs and risk provisioning over the remaining term of the entire portfolio. This figure therefore corresponds to a potential liquidation value of the Company without factoring in planned growth. In contrast, contribution margin 2 (CM2) reflects the total embedded value of the leasing new business generated in a given period, before costs and taxes.
We use embedded value as an additional key performance indicator for two reasons: First, because expenses incurred when expanding into new markets, carrying out cell divisions, and opening new branches in our markets are usually not immediately covered by income until after the start-up phase has ended. Second, because the internal interest in our lease receivables is largely fixed over the remaining term of a portfolio and only reflected in net interest income over the term as a result of IFRS lease accounting. At the same time, refinancing with matching maturities provides a high degree of forecasting certainty for interest expenses and therefore for the total outstanding interest result over the remaining term. With the help of embedded value-based management, we take into account future earnings contributions from leasing new business and combine two goals into one: growth in new business with an increase in net asset value.
Return on equity (RoE) after taxes is becoming an increasingly important management metric. It is calculated as the ratio of Group earnings to the average equity employed over the defined time period. RoE measures the return generated on invested equity. We manage our local subsidiaries and sales entities based on their respective contribution to Group RoE. In addition to operating income and the CM2 of new business, costs and thereby the CIR, as well as efficient capital allocation, play a decisive role.
Performance indicators Banking
One of the key performance indicators of grenke Bank is deposit volume, as the Bank is responsible for an important component of the grenke Group’s refinancing strategy through the purchase of lease receivables. grenke Bank is also managed based on its equity position, focusing on the equity ratio, the total capital ratio in accordance with the Capital Requirements Regulation (CRR), the leverage ratio, and the liquidity coverage ratio (LCR).
Performance indicators Banking
Unit
2025
2024
2023
Deposit volume
EURm
2,408.2
2,308.0
1,686.0
Equity ratio
Percent
17.3
19.2
21.6
Total capital ratio
Percent
17.3
19.4
21.9
Leverage ratio
Percent
11.1
10.9
14.1
Liquidity coverage ratio
Percent
565.4
997.3
1,565.4
The respective medium-term targets for the Consolidated Group’s relevant financial performance indicators and the forecast for the 2026 financial year can be found in Chapter 6.2 Report on forecasts and outlook.
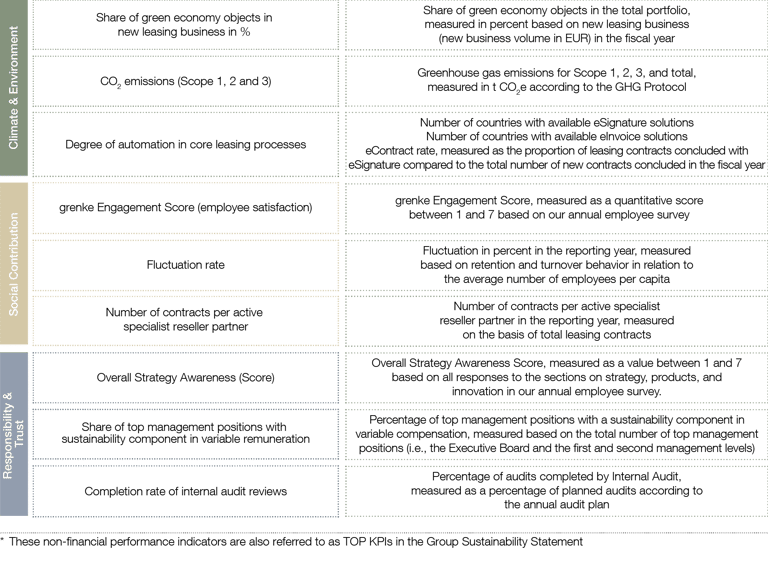
Non-financial performance indicators*
In addition to the financial performance indicators (key performance indicators – KPIs) described in Chapter 1.3.1, the enterprise value of the grenke Group is also influenced by non-financial performance indicators.
In the 2025 financial year, we continued to drive forward the grenke Group’s sustainability strategy and activities. The defined TOP KPIs were further developed and assigned updated target values. A new TOP KPI, the “number of contracts per active specialist reseller partner”, was introduced, measuring customer security and customer satisfaction in accordance with ESRS S4. This replaces the former TOP KPI “number of training days per employee”. An overview of our key KPIs is presented in the following figure, while additional non-financial indicators are published as part of sustainability reporting (see Chapter 3, Group Sustainability Statement 2025).
Share of green economy objects in leasing new business (%)
We are committed to making our product portfolio and leasing contracts as sustainable as possible. Our focus is on green economy objects, consisting primarily of equipment for generating and storing renewable energy, sustainable mobility solutions, and resource management initiatives that support the transformation of our SME customers and the broader economy. Our aim is to gradually increase the proportion of these objects within the net acquisition volume of leasing new business. In the 2025 financial year, this share stood at 8.1 percent (2024: 7.8 percent). The corresponding TOP KPI measures the percentage share of green economy objects within the total portfolio (see this annual report, Chapter 3 Group Sustainability Statement 2025).
Greenhouse gas emissions (GHG emissions; Scope 1, 2 and 3)
As part of our sustainability strategy, we have defined a clear climate target: by no later than 2050, we aim to achieve net-zero emissions across all business activities and thereby actively contribute to the 1.5-degree target of the Paris Climate Agreement. The climate action plan developed for this purpose sets interim targets for 2030 and defines key milestones (see Chapter 3 Group Sustainability Statement 2025 under Section ESRS E1).
To track our progress, we calculate the corporate carbon footprint on an annual basis. This involves measuring greenhouse gas emissions from direct operations (Scope 1), indirect energy use (Scope 2), and the upstream and downstream value chain (Scope 3) in accordance with the Greenhouse Gas (GHG) Protocol. In the 2025 financial year, Scope 3 reporting was expanded for the first time to include emissions from lease objects. This marks an important step toward covering our corporate carbon footprint.
The figures published for the 2025 financial year are based on the currently available consumption data. Missing datapoints were supplemented with prior-year estimates (see Chapter 3 Group Sustainability Statement 2025 under Section ESRS 2 and ESRS E1).
In the 2025 reporting year, total greenhouse gas emissions across all three scopes amounted to 2,613,766 tonnes of CO2e, of which 99.88 percent, or 2,610,756 tonnes of CO2e, related to Scope 3. The initial inclusion of leased assets increased Scope 3 emissions by 2,607,266 tonnes of CO2e, accounting for 99.75 percent of the total footprint. The categories of greenhouse gas emissions that were reported in the previous year and are unrelated to lease objects were reduced by 17 percent in the 2025 financial year.
Our Scope 1 emissions amounted to 2,326 t CO2e in the reporting year (2024: 2,690 tonnes of CO2e) and declined by 14 percent, representing 0.09 percent of the total. Our Scope 2 emissions (location-based) totalled 684 t CO2e (2024: 960 tonnes of CO2e) and declined by 29 percent year-on-year, representing 0.03 percent of the total. Our Scope 2 emissions (market-based), in contrast, came to 914 t CO2e (2024: 1,440 t CO2e).
In Scope 3, we recorded 2,610,756 t CO2e (2024: 4,183 t CO2e), representing 99.88 percent of our total carbon footprint, of which 99.75 percent is attributable to our leased objects.
The corresponding TOP KPI measures total greenhouse gas emissions (Scope 1 – 3) in t CO2e in accordance with the GHG Protocol and serves as a central metric for managing our climate targets.
Degree of automation in the core leasing process
In the 2025 financial year, we further increased the level of automation in the core leasing process. This automation is a core driver of the digital transformation, resource efficiency, and the governance strength of our small-ticket leasing model. We track progress using three indicators: the number of countries where the eSignature solution is available, the number of countries with eInvoice functionality, and the eContract ratio, representing the percentage of newly signed lease agreements processed via a digital signature.
In 2025, eSignature solutions were available in 24 countries (compared to 27 in the previous year). The reduction was solely due to the wind-down of our entities in Turkey and Singapore and the consolidated counting approach for the entities in the United States, and not to any technical limitations. The eContract ratio remained stable at 40.1 percent of new contracts (2024: 40.5 percent). Digital invoicing (eInvoice) remained consistently available in 26 countries.
Through 24/7 availability, self-service features, and integrated controls, we are enhancing service levels for customers and partners, reducing paper consumption, and ensuring legally compliant processes.
The TOP KPI, which combines these three components, is being further enhanced to continuously increase automation from the initial enquiry through to contract termination, thereby strengthening our sustainability and efficiency strategy over the long term (see Group Sustainability Statement 2025 under Section ESRS E1).
grenke Engagement Score (employee satisfaction)
The grenke Engagement Score (GES) is our primary tool for measuring employee satisfaction. It is derived from the annual survey and consolidates feedback in the areas of engagement, identification, commitment, retention and overall assessment of the Company into a single score ranging from 1 (high satisfaction) to 7 (low satisfaction). Our long-term target is a score of no greater than 2.2. In the 2025 financial year, we once again met this target: the GES was 2.2, with a participation rate of 70.3 percent, which was higher than the previous year’s rate of 67.8 percent (see Group Sustainability Statement 2025 under Section ESRS S1).
Fluctuation rate
We regard the employee fluctuation rate as an important indicator of sustainable HR and talent management and of grenke’s attractiveness as an employer. Based on this rate, we are able to assess the retention and fluctuation of our workforce.
The objective is to achieve a significantly lower employee fluctuation rate than the industry average for financial and insurance service providers in Germany (16.3 percent – German Federal Statistical Office 2025, based on labour market data from 2023). In the 2025 financial year, the Group-wide average fluctuation rate was 7.8 percent (2024: 8.9 percent). As a result, grenke has remained consistently below the industry benchmark for four consecutive years and shows an improvement in the employee fluctuation rate. The associated TOP KPI measures staff turnover in percent in the reporting year, based on the number of employees who left grenke in relation to the average number of employees (see Chapter 3 Group Sustainability Statement 2025 under Section ESRS S1).
Number of contracts per active specialist reseller partner
In the 2025 financial year, 82.1 percent of grenke’s sales volume was generated via the specialist reseller partner channel (2024: 83.2 percent). This channel is a key lever for providing SME customers with secure and satisfactory financing solutions.
To manage this distribution channel, we track the average number of lease contracts per active specialist reseller partner. In 2025, this figure was 9.3 contracts (2024: 8.9), reflecting a steady increase in customer retention and alignment with our sales strategy of generating more contracts per existing customer.
Our long-term objective is to achieve two additional contracts per active specialist reseller partner by 2030, compared with the 2025 reference year. This aim supports long-term customer security and satisfaction, as well as sustainable access to financing solutions for SMEs.
The associated TOP KPI measures the number of contracts per active specialist reseller partner in the reporting year, based on total leasing contracts (see Chapter 3 Group Sustainability Statement, Section ESRS S4).
Overall Strategy Awareness (OSA) Score
To effectively implement its corporate and sustainability strategy, grenke places a high value on employee involvement and support. grenke’s Overall Strategy Awareness (OSA) Score measures how well employees understand and identify with the strategy. The OSA score is calculated from responses in the areas of strategy, products, and innovation in the annual employee satisfaction survey, using a scale from 1 (high awareness) to 7 (low awareness). The long-term goal is to achieve an average OSA score of 2.5.
In the 2025 financial year, the OSA Score was 2.7, compared to 2.6 in the previous year. The score is therefore virtually unchanged year-on-year, remaining slightly above the target level. The Overall Strategy Awareness Score remains the key TOP KPI for evaluating the strategic orientation of employees.
To reach the target value of 2.5, additional communication and training initiatives are planned for the next reporting period to further enhance strategic alignment (see Chapter 3 Group Sustainability Statement 2025 under Section ESRS G1).
Share of top management positions with a sustainability component in variable remuneration
For Group-wide management of our sustainability strategy, grenke links sustainability aspects to the variable remuneration of its top management. The associated TOP KPI measures the proportion of senior management positions – specifically the Board of Directors and the next lower management tier (vice presidents) – that have a sustainability component in their variable remuneration.
In the 2025 financial year, this share was 12.6 percent, up from 1.69 percent in the previous year (2024). The marked increase is attributable to the further introduction of sustainability-related remuneration parameters for vice presidents in the reporting year.
The ESG-related criteria for both the Board of Directors and vice presidents are reviewed, updated, and assessed individually on an annual basis. Climate-related components have not yet been incorporated into variable remuneration. We continue to track the progress using the TOP KPI “Share of senior management positions with a sustainability component in variable remuneration” (see Group Sustainability Statement 2025 under Section ESRS G1 and ESRS 2 GOV-3).
Completion rate of internal audits
We reinforce our governance structure through effective and efficient processes and controls to ensure lawful and integrity-based conduct. To support this, we track the percentage of completed audits relative to the total number of audits scheduled for the financial year by Internal Audit across the grenke Group. Our year-end goal is to fully complete 85 percent of these audits. The remaining 15 percent is expected to be in progress and considered fully completed by the end of the following first quarter. We treat the 85 percent target as valid in the short, medium, and long term. This target applies to our own operations and is jointly pursued with the Internal Audit department. In 2025, the Internal Audit completion rate was 70 percent (2024: 65 percent (see Chapter 3 Group Sustainability Statement, Section ESRS G1).
Further details on target achievement and target-versus-actual comparisons for the individual non-financial performance indicators (TOP KPIs) are provided in Chapter 3 Group Sustainability Statement.
Research and development
Our core capabilities include standardised processes and, particularly in leasing, a high degree of data-driven, digitalised processes and application assessment. We continuously optimise our software solutions and applications to maintain these capabilities. As part of our Digital Excellence strategy, we have developed a modern, cloud-based IT and system landscape that enables seamless end-to-end digitalisation of leasing and core processes. Central components include automated workflows, a unified data foundation, and scalable platforms aimed at boosting efficiency, transparency, and speed. In the reporting year, a major technical focus was the migration of our IT operations to a secure cloud infrastructure and the completion of the modular environment required to run cloud-based applications.
Since 2024, we have been expanding our capabilities for the secure use of artificial intelligence (AI) and have already begun successfully applying it to initial use cases. We see the benefits of AI integration in our ability to process large volumes of data, accelerate contract assessment and billing, potentially increase contracts per dealer, grow contract volume per customer, and reduce the cost per transaction and ultimately per lease contract. In collaboration with various specialist service providers and research institutions, we are actively building our own AI platform focused on generative AI, machine learning, and AI agents. Our aim is twofold: to improve operational efficiency by embedding AI into our software systems and to equip employees with advanced tools to help carry out their responsibilities successfully. We made the conscious strategic decision to develop our own AI platform to minimise our future operating costs, reduce our dependence on large AI providers, and maintain full data sovereignty over our critical infrastructure.
We are consistently advancing the development and implementation of automated and customer-centric processes for sales and administration. In 2025, we successfully integrated our loan units globally and established the technical foundations for renewing the leasing platform.
grenke digital GmbH plays a key role in this context by consolidating our technical digital expertise and developing system solutions for our own use and our ecosystem. In June 2025, grenke digital GmbH expanded its portfolio through the acquisition of the Italy-based service company B2F S.r.l., which operates technology platforms specialising in the integration of payment solutions into eCommerce shops. This acquisition enhances our eCommerce integration capabilities and enables us to offer leasing directly as an additional payment option in online shopping. In 2025, grenke digital GmbH employed around 195 people (previous year: 190). In 2025, development costs of EUR 6.6 million (previous year: EUR 2.0 million) were capitalised. The amortisation of internally generated software amounted to EUR 2.7 million (previous year: EUR 4.0 million). We also utilised third-party services for research and development purposes. In the 2025 reporting year, such services were mainly used in connection with IT projects and totalled EUR 19.4 million (previous year: EUR 15.8 million). Of this amount, EUR 4.3 million (previous year: EUR 1.0 million) was capitalised.
More about non-financial indicators
Learn more about our sustainability strategy and activities.
Downloads
Reports & Presentations
Find out more about our reports here.
Save the date now! Calendar 2026
Stay up to date and meet us at an event.

Always stay tuned
You have questions? We have the answers. Get in touch with us or sign up for our IR newsletter.


