 grenke around the globe
Please note that this website shows an excerpt from the grenke AG Annual Report 2025. The annual report, which is also available in the “Reports & Key Figures” section of the grenke AG website, prevails.
Our Board of Directors
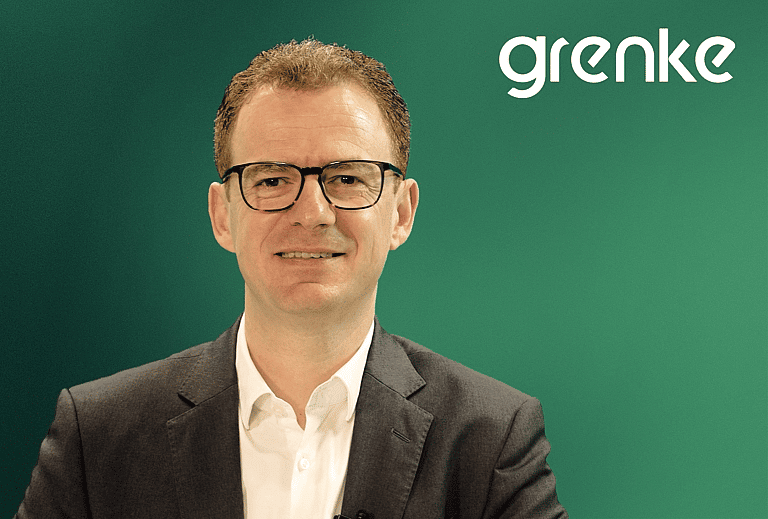
Statement from the Chief Executive Officer, Dr. Sebastian Hirsch
Our Supervisory Board

Report of the Supervisory Board
Jens Rönnberg WP/StB, Chair of the Supervisory Board
grenke Management
Learn more about the Board of Directors and the Supervisory Board.
Group key figures new business
Unit
2025
2024
Change (%)
Leasing new business
EURk
3,294,567
3,057,009
7.8
DACH
EURk
801,434
705,075
13.7
Western Europe (without DACH)
EURk
851,086
784,413
8.5
Southern Europe
EURk
797,045
731,992
8.9
Northern/Eastern Europe
EURk
608,976
640,758
–5.0
Other regions
EURk
236,027
194,771
21.2
Contribution margin 2 (CM2) on leasing new business
EURk
550,238
518,506
6.1
DACH
EURk
109,905
95,158
15.5
Western Europe (without DACH)
EURk
147,470
139,776
5.5
Southern Europe
EURk
135,438
123,799
9.4
Northern/Eastern Europe
EURk
108,999
117,578
–7.3
Other regions
EURk
48,426
42,195
14.8
Further information leasing
Number of new contracts
Units
324,019
315,901
2.6
Mean acquisition value
EUR
10,168
9,677
5.1
Mean term of contract
Months
49
49
0.0
Further information leasing portfolio
Volume of leased assets per end of period
EURk
11,432,028
10,122,488
12.9
Number of current contracts per end of period
Units
1,157,268
1,093,555
5.8
grenke Bank
SME lending new business incl. microcredit business
EURk
40,582
37,768
7.5
Regions Leasing
DACH: Germany, Austria, Switzerland
Western Europe (without DACH): Belgium, France, Luxembourg, the Netherlands
Southern Europe: Italy, Croatia, Malta, Portugal, Slovenia, Spain
Northern/Eastern Europe: Denmark, Finland, UK, Ireland, Latvia, Norway, Poland, Romania, Sweden, Slovakia, Czechia, Hungary
Other: Australia, Brazil, Chile, Canada, United States, UAE
Group key figures income statement
Unit
2025
2024
Change (%)
Income statement
Interest and similar income from financing business
EURk
668,607
574,348
16.4
Expenses from interest on refinancing including deposit business
EURk
263,460
217,611
21.1
Operating expenses
EURk
364,583
341,019
6.9
Result from settlement of claims and risk provision
EURk
– 195,953
– 131,012
49.6
Operating result
EURk
97,682
90,015
8.5
Group earnings before taxes
EURk
93,432
89,402
4.5
Group earnings
EURk
71,775
70,158
2.3
Group earnings attributable to ordinary shareholders
EURk
57,146
65,446
– 12.7
Group earnings attributable to hybrid capital holders
EURk
12,615
10,498
20.2
Group earnings attributable to non-controlling interests
EURk
2,014
– 5,786
134.8
Earnings per share (basic and diluted)
EUR
1.29
1.44
– 10.4
Return on equity after tax
Percent
5.2
5.2
0.0 pp
Cost-income ratio
Percent
55.2
59.2
-4.0 pp
Staff costs
EURk
215,226
198,209
8.6
of which total remuneration
EURk
175,706
162,593
8.1
of which fixed remuneration
EURk
145,553
139,140
4.6
of which variable remuneration
EURk
30,153
23,453
28.6
Average number of employees in full-time equivalents (FTEs)
Employees
2,331
2,196
6.1
Group key figures consolidated statement of financial position
Unit
Dec. 31, 2025
Dec. 31, 2024
Change (%)
Statement of financial position
Total assets3
EURm
9,089
8,193
10.9
Lease receivables
EURm
7,342
6,516
12.7
Deposit volume grenke Bank
EURm
2,315
2,229
3.9
Equity pursuant to statement of financial position1
EURm
1,418
1,323
7.2
Equity pursuant to CRR
EURm
1,090
1,168
– 6.7
Equity ratio
Percent
15.6
16.2
-0.6 pp
Embedded value, leasing contract portfolio (excl. equity before taxes)
EURm
651
560
16.3
Embedded value, leasing contract portfolio (incl. equity after taxes without hybrid capital)2
EURm
1,608
1,519
5.9
1 Including AT1 bonds (hybrid capital), which are reported as equity under IFRS.
2 Previous year's figure adjusted, as hybrid capital is not included in the calculation.
3 Adjustment in accordance with IAS 8 (see Note 2.3 of the notes to the consolidated financial statements).
The grenke share
Performance of the grenke share and indices (January 1 to December 31, 2025)
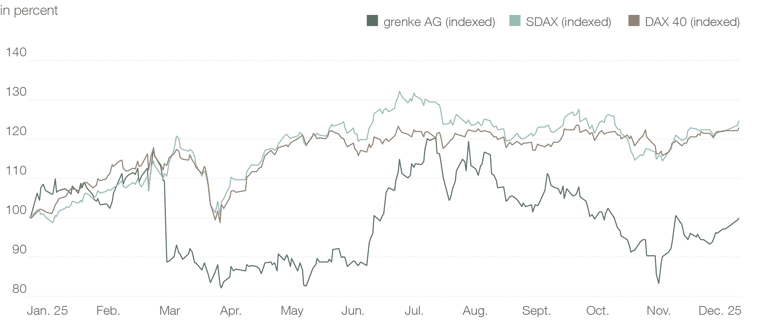
In 2025, grenke AG’s share price remained volatile amid an overall challenging capital market environment. After opening at EUR 15.66 on January 2, 2025, the share price initially rose, reaching EUR 17.12 on March 12, 2025. Following the release of the annual financial statements and 2025 guidance on March 13, 2025, the shares dropped to EUR 13.90 and subsequently trended sideways. On April 10, 2025, the shares recorded their lowest level for the year at EUR 12.86. At the end of June 2025, the shares began to recover – similar to the SDAX – supported by the publication of the second quarter new business figures on July 3, 2025. This was followed by the shares’ year high of EUR 18.84 on July 28, 2025.
The shares subsequently trended lower, falling to EUR 13.04 by November 19, 2025. This period also included the publication of third-quarter figures and an interpretation of the guidance on November 13, 2025. On November 20, 2025, the share price reversed course, posting gains through to the end of the financial year. On December 30, 2025, grenke shares closed at EUR 15.64, close to the year’s opening price on January 2, 2025. The actual share price change for the full year 2025 was – 0.13 percent.
With a total of 46,495,573 registered shares, the market capitalisation of grenke AG equalled EUR 727 million as of December 31, 2025. As of December 31, 2025, the embedded value (net asset value) amounted to EUR 1,608 million. The embedded value serves as an economic benchmark for valuation as it encompasses the equity, as well as the present value of expected future cash flows from the existing business, after costs and risk provisioning. The net asset value per share equals EUR 36.40.
Trading volume for the grenke share (January 1 to December 31, 2025)
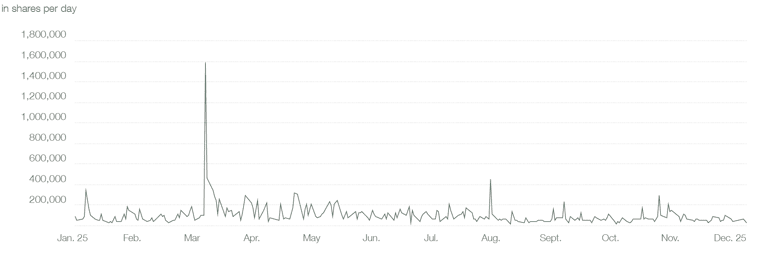
In 2025, the average daily trading volume in grenke shares on Xetra was 102,771 shares. The highest daily trading volume was 1,583,715 shares, recorded on March 13, 2025, upon publication of the 2024 full-year results. The lowest single-day trading volume was 17,737 shares on August 25, 2025. Over the full 2025 financial year, the total trading volume in grenke shares on Xetra reached 26 million shares.
Share data
Unit
2025
2024
2023
Closing price on last day of financial year
EUR
15.64
15.42
25.05
Highest share price
EUR
18.84
28.55
32.45
Lowest share price
EUR
12.86
15.04
19.28
Market capitalisation
EURm
727
717
1,165
Embedded value1
EURm
1,608
1,519
1,489
Embedded value per share2
EUR
36.40
34.38
32.02
Earnings per share
EUR
1.29
1.44
1.79
Dividend per share3
EUR
0.42
0.40
0.47
Dividend yield3
Percent
2.69
2.59
1.88
Price-earnings ratio
12.12
10.71
13.99
Share prices based on Xetra closing prices.
1 Previous years’ figures were adjusted, as hybrid capital is not included in the calculation.
2 Since 2024: relative to the 44,177,878 shares entitled to liquidation as of December 31.
3 2025: Proposal to the Annual General Meeting.
Fundamentals of our share
Get all information about the grenke share here.
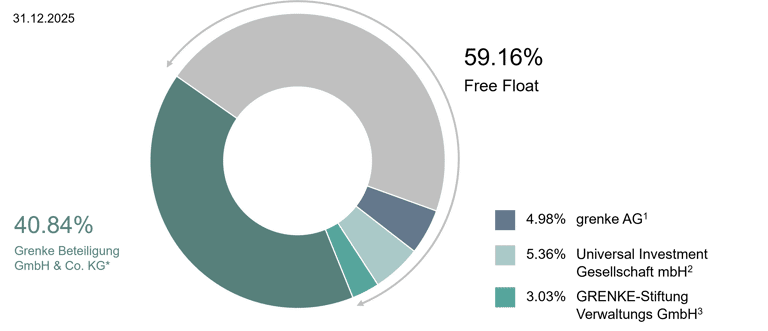
Shareholder structure
1) According to Press Release on October 1, 2024
2) Changes resulting from the Voting Rights Announcement on February 10, 2026 are not taken into account here
3) According to Voting Rights Announcement on December 27, 2024
* Single-member limited partnership structure (General partner: Grenke Vermögensverwaltung GmbH, Limited partners: Wolfgang Grenke, Anneliese Grenke, Moritz Grenke, Roland Grenke, Oliver Grenke)
Grenke Beteiligung GmbH & Co. KG and grenke AG have entered into a prophylactic control termination agreement. You can view its content here.
The above information is not guaranteed and based on the voting right notifications received by the Company in accordance with the German Securities Trading Act (WPHG).
We are a medium-sized company, with Grenke Beteiligung GmbH & Co. KG. as our major shareholder. Following the reorganisation of Grenke Beteiligung GmbH & Co. KG into a single-member limited partnership structure, under which the KG holds all shares in the general partner GmbH, Grenke Vermögensverwaltung GmbH no longer acts as the parent company of Grenke Beteiligung GmbH & Co. KG. Accordingly, and in line with our notification pursuant to the German Securities Trading Act (WpHG) dated November 7, 2025, the voting rights attached to the shares held by Grenke Beteiligung GmbH & Co. KG are no longer attributed to Grenke Vermögensverwaltung GmbH. The limited partners of Grenke Beteiligung GmbH & Co. KG continue to consist of Anneliese Grenke, company founder Wolfgang Grenke, and their three adult sons, Moritz, Roland, and Oliver Grenke. As of the December 31, 2025 reporting date, Grenke Beteiligung GmbH & Co. KG continued to hold 40.84 percent of the Company’s shares. As a result of the share buyback programme completed in 2024, grenke AG continued to hold 2,317,695 treasury shares in the past financial year, corresponding to a 4.98 percent stake. According to the publication date of the respective voting rights notifications, entities holding more than 3 percent of the Company also included Universal Investment Gesellschaft mbH, with a 5.36 percent share, and GRENKE-Stiftung, with 3.03 percent. The free float, as defined by Section 5.7.2 of the current DAX Equity Index Methodology Guide, amounted to 59.16 percent. The shareholding of the Board of Directors and Supervisory Board as of the reporting date was approximately 0.2 percent. The individual shareholdings of the members of the Board of Directors and Supervisory Board can be found in the table in Chapter 8.6 Shareholdings of the Board of Directors and Supervisory Board, contained in the Corporate Governance Statement.
Our shareholder structure
Find out all about our shareholder structure.
Our analyst ratings
How do analysts rate the grenke share? Find out here.
Our dividend policy
A key element of our growth strategy is a reliable dividend policy. For years now, the payout ratio has been around 25% of Group earnings.
Dividend in EUR
*Dividend proposal to the Annual General Meeting (April 24, 2026)
On May 7, 2025, grenke AG held its ordinary Annual General Meeting as an in-person event, as in the previous year. A total of 28,369,903 votes, including absentee votes, were represented, accounting for 61.02 percent of the Company’s share capital. Shareholders approved the proposal by the Supervisory Board and Board of Directors to distribute a dividend of EUR 0.40, amounting to a total payout of EUR 17.7 million and a payout ratio of 25 percent of Group earnings.
For years, grenke AG has maintained a stable dividend policy, aiming to distribute approximately one-quarter of Group earnings. For the 2026 financial year, the Supervisory Board and Board of Directors are proposing a dividend of EUR 0.42 per share, representing a payout ratio of around 25 percent.
More details on the composition of the Supervisory Board can be found in Chapter 8.2.2 Supervisory Board, in the Corporate Governance Statement.
The 2025 financial year for Investor Relations


Downloads
Reports & Presentations
Find out more about our reports here.
Save the date now! Calendar 2026
Stay up to date and meet us at an event.

Always stay tuned
You have questions? We have the answers. Get in touch with us or sign up for our IR newsletter.


